Study Mode
The Study mode is your primary tool for studying GTO Solutions. You can browse the solution in detail for any situation, from preflop to river. This is your go-to resource for analyzing the GTO strategy on any board.
This guide will teach you how to navigate the Study mode like a pro. Here we’ll cover all the main features, with links to detailed guides for specific features.
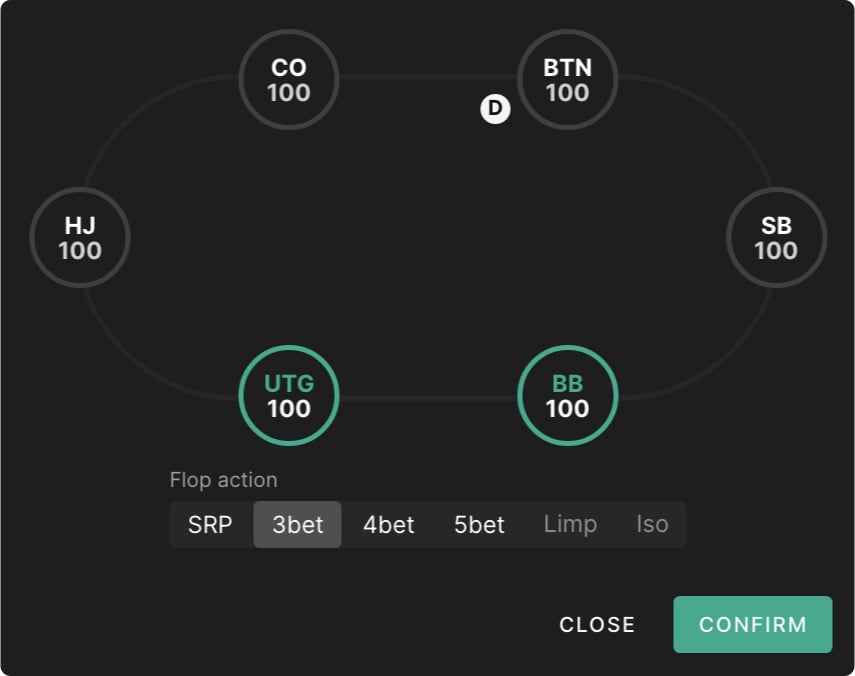
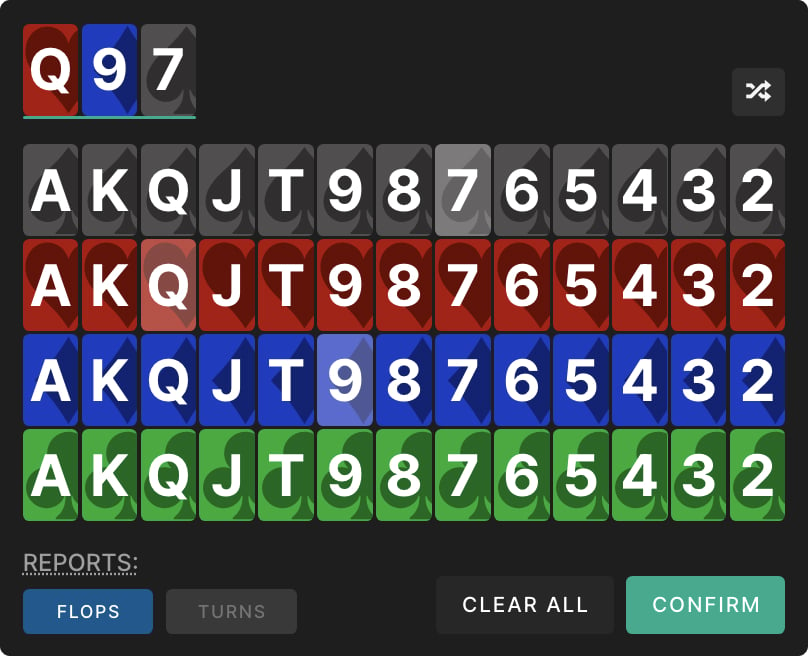
Next, simply select the flop:
After you pick your cards, click on the confirm, and you can see your strategy for BTN Vs BB 3bet on Q97r.
Study Mode Overview
There are four primary tabs along the top:

- Strategy Tab – This shows you strategic information about your range. This tab also has the option to show equity, EV, equity realization, range weights, or all metrics simultaneously.
- Ranges Tab – This lets you compare and contrast the composition of ranges, view equity distributions, hand class breakdowns, copy ranges to your clipboard, and more.
- Breakdown Tab – This is used to break down how actions within your range are constructed. You can see how various hand classes want to play, compare the composition of different bet sizes, and more.
- Reports Tab – This will take you to aggregate reports, which are used to find deeper trends across different board textures in the same scenario. Aggregate reports contain data from all 1755 flops.
Strategy Tab
The Strategy tab is the main focus of the Study mode. This tab is used to study the GTO strategy for any spot you like. The interface consists of four main sections:
- The strategy matrix – Shows the GTO strategy for the entire range.
- The infobox – Shows the pot size, board state, and positions.
- Actions table – Shows actions of the whole range.
- The hand matrix – Shows the actions of a selected hand.
Strategy Matrix
Let’s start with an example. BTN opens, BB calls, flop Q97r:
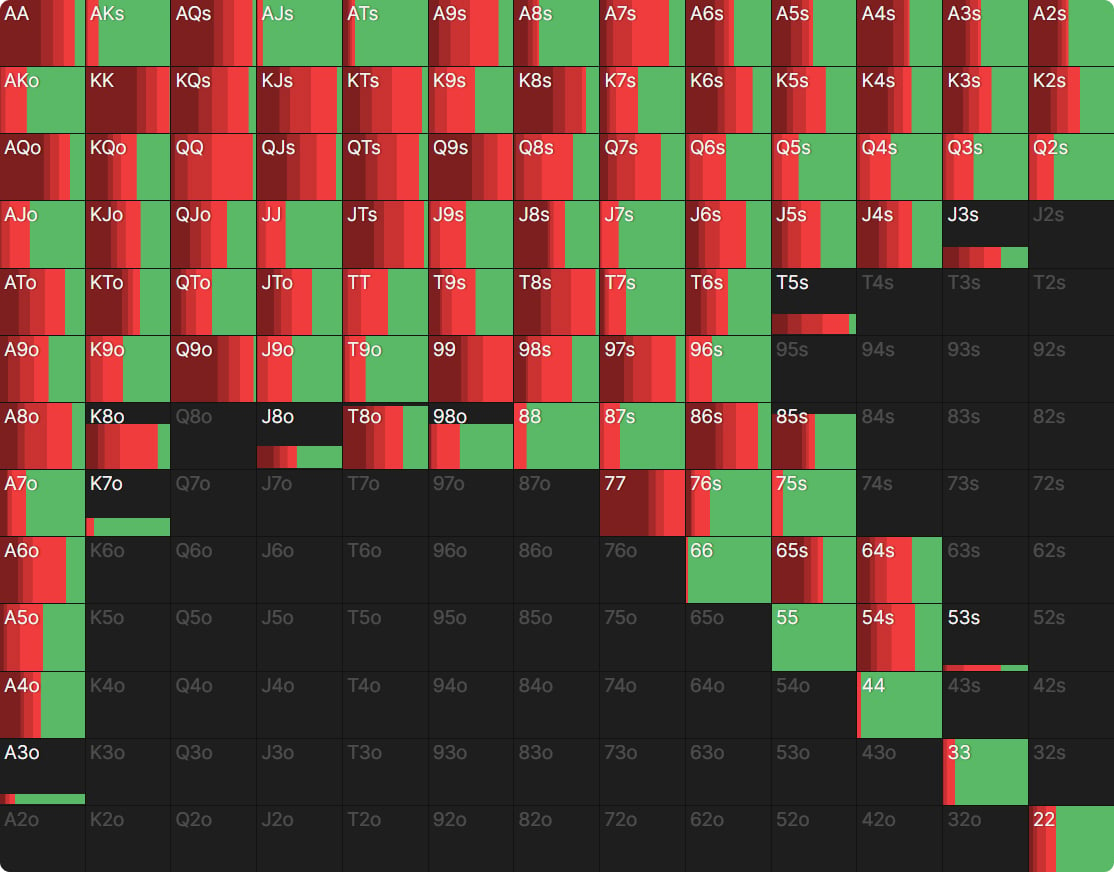
The strategy matrix shows us the strategy of the entire range. Each hand is color-coded according to their strategy.
Let’s take a look at 77, for example. This hand is entirely 🔴 red, indicating it should bet 100% of the time on the flop. 55, on the other hand, is entirely 🟢 green, indicating it should check 100% of the time. Hands that are completely ⚫ black, such as 72o, are not in your range. That’s because they take a different line (folding preflop in this case).
Infobox
The infobox shows the positions, pot size, and board cards. The BTN is highlighted, indicating it’s their turn to act. The 5.5BB pot size is displayed, along with the flop cards.
BTN bets 33% pot (1.8BB). The BB is highlighted, indicating their turn. We now see two pot sizes, 7.3 and 5.5, representing the pot before and after BTN’s bet.
You can also see the pot odds to call – Pot odds tell you what portion of the pot the defender needs to win to justify calling. In this case, if BB can capture at least 20% of the pot they have a breakeven call.
Hand Matrix
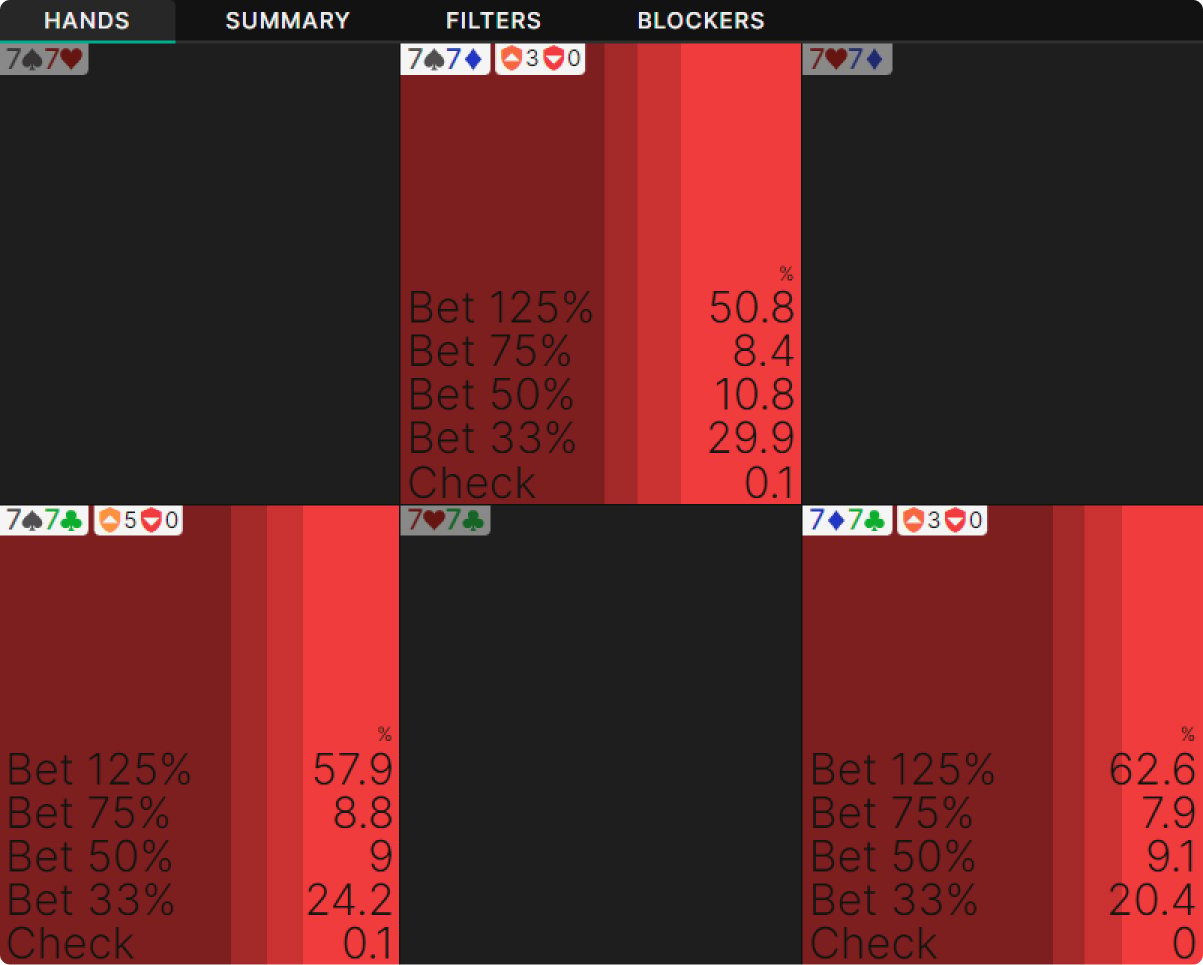
Hovering over any hand will reveal the GTO strategy in more detail in the hand matrix (bottom right corner). Here we can see the different bet sizes 77 uses. It prefers an overbet but can also play using a smaller bet. We can see that 77’s containing a heart are black. That’s because the 7♥ is on the board and, therefore not in our range.
Summary Tab
The Summary tab displays the strategy, range (weight), EV, EQ, EQR, and Value/Trash removal scores.
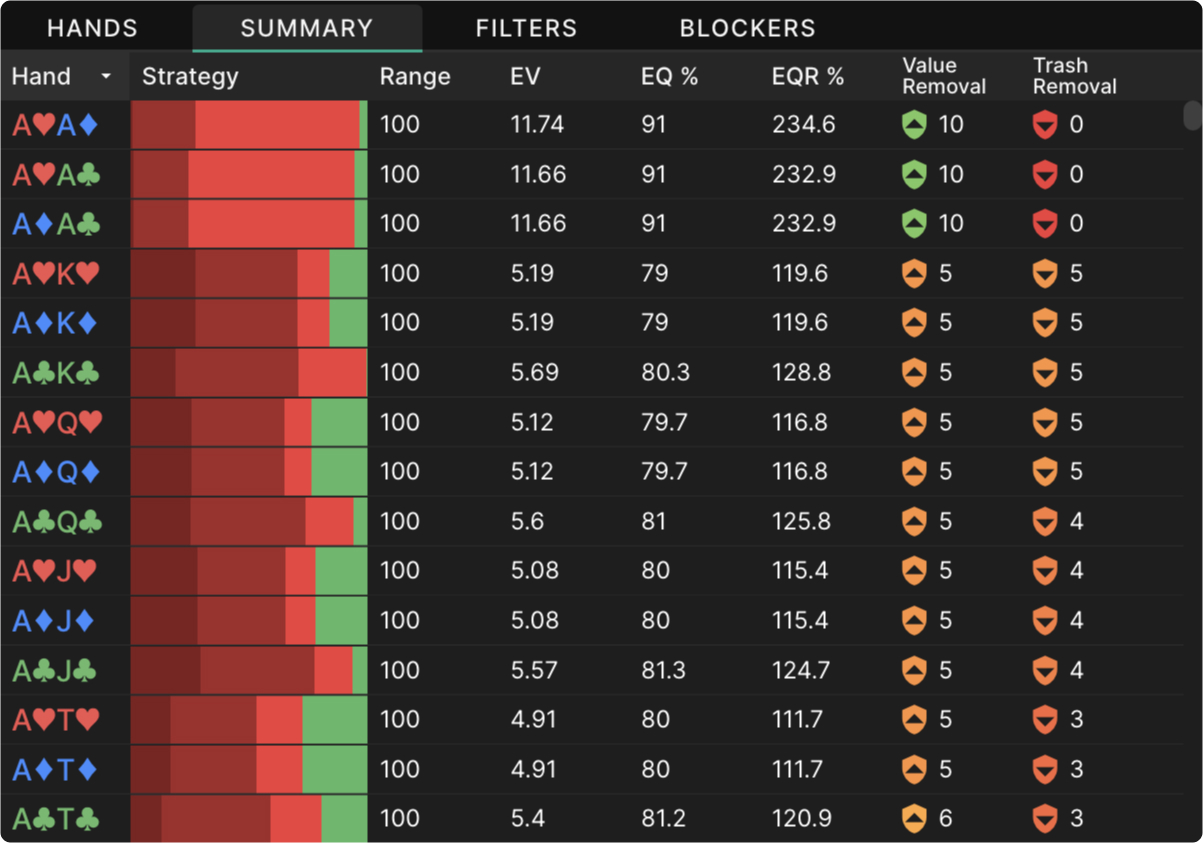
Value Removal is scored from 0 to 10. This indicates how much EV your hand removes from the top of your opponent’s range due to card removal.
A low score (0) means your hand does not block value in your opponent’s range. This is desirable when value betting.
A high score (10) means your hand blocks a lot of value in your opponent’s range. This is desirable when bluffing or bluff-catching.
Trash Removal is scored from 0 to 10. This indicates how much trash you block in your opponent’s range due to card removal.
A low score (0) means you do not block trash in your opponent’s range. This is desirable when bluffing or bluff-catching.
A high score (10) means you block a lot of trash in your opponent’s range. This is desirable when value betting.
Select any of the headers to sort this table. This is a great way to find your best value bets or bluffs. Hands in the summary table obey filtering criteria as described below. If you select some hand in the strategy matrix then only those combinations will be shown.
Blockers Tab
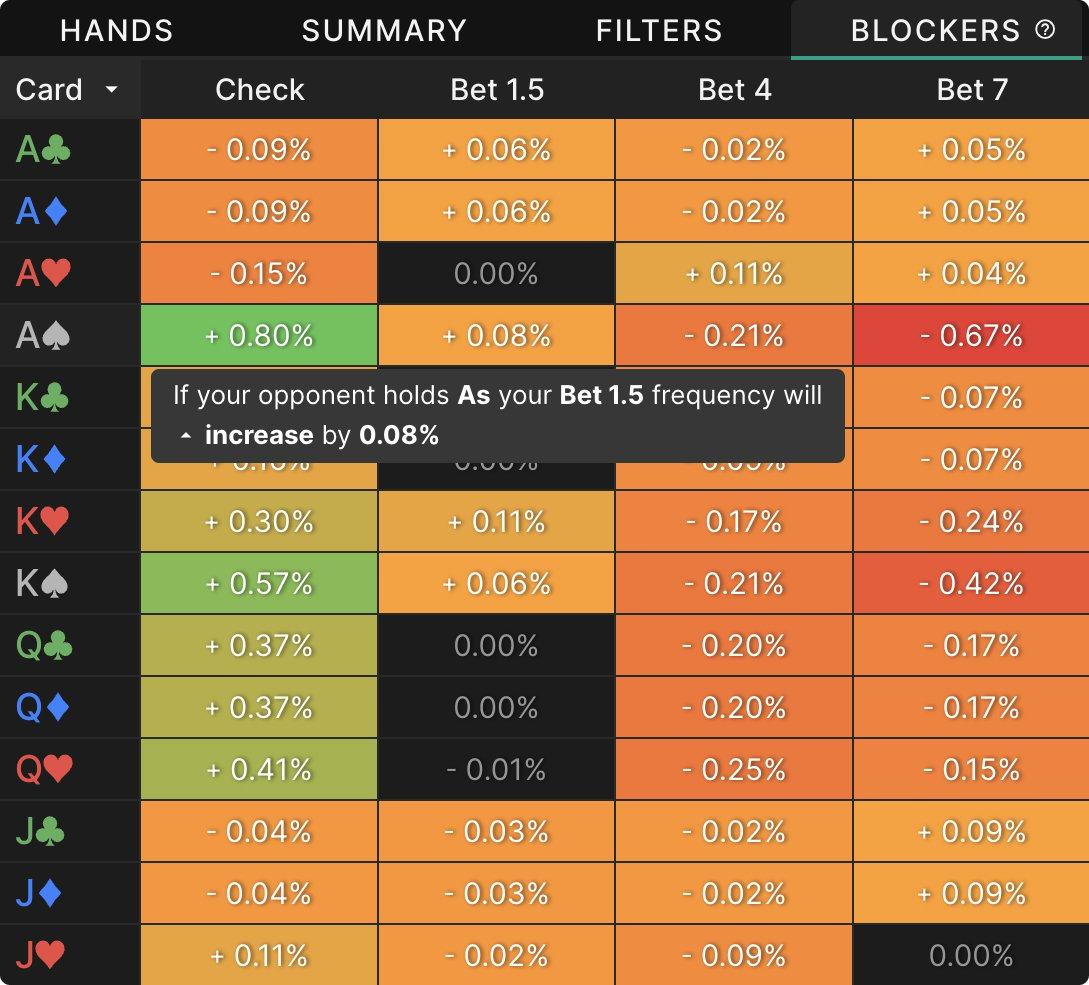
Use the Blocker’s tab to see how card removal affects the frequency of your actions. This is a great way to find relevant blockers!
You can sort this table by cards or any header to find cards that have the biggest impact on your frequencies.
The card removal is based on your opponent’s holdings. Go into your opponent’s range to see how your blockers affect their frequencies, and vice versa.
Usage examples:
- If you want to find good bluffs, select a bet size and go into your opponent’s Blockers tab.
Sort by most folded to find out what blocked cards cause them to fold more. - If you want to find good slow plays, select check and sort by least checked to find what cards cause them to bet more.
Actions Table
Below the infobox, we can see the Actions table. This section tells us the average strategy of our entire range. For example, BTN should overbet 6.9BB (125% pot-sized bet) 18.1% of their range, and check 44% of the time overall.
The Actions table has some additional functions:
- Select any one of the actions to filter for hands in your range that take that action.
- Select the dropdown in the bottom right corner (or press ‘s’) to group similar actions together, or graph the betting frequencies.
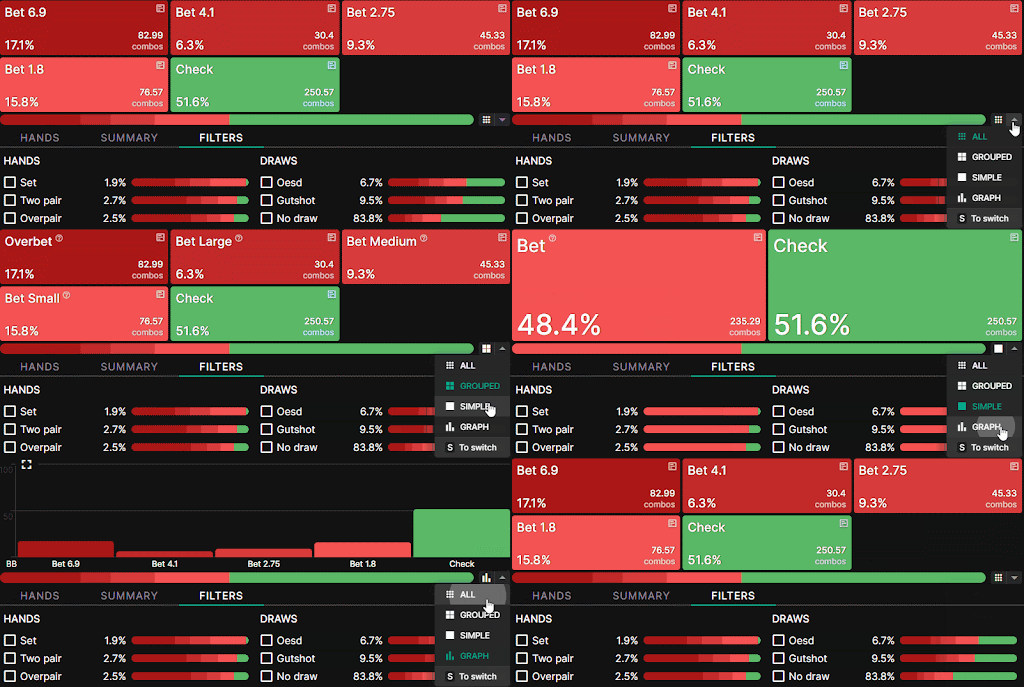
- Select the icon in the top-right corner of any action to see a range breakdown. This breakdown tells you how each range is constructed. For example, the overbetting range is mainly built using top pair+ for value, balanced with about 60% unmade hands and gutshots.
Filters
Hand Category Filters
The Filters tab can be found above the Hand matrix. This is a handy feature that shows you the proportion of different hand classes in your range. Select any category to filter your range in the Strategy matrix. This filter will also update the frequencies in the Actions table.
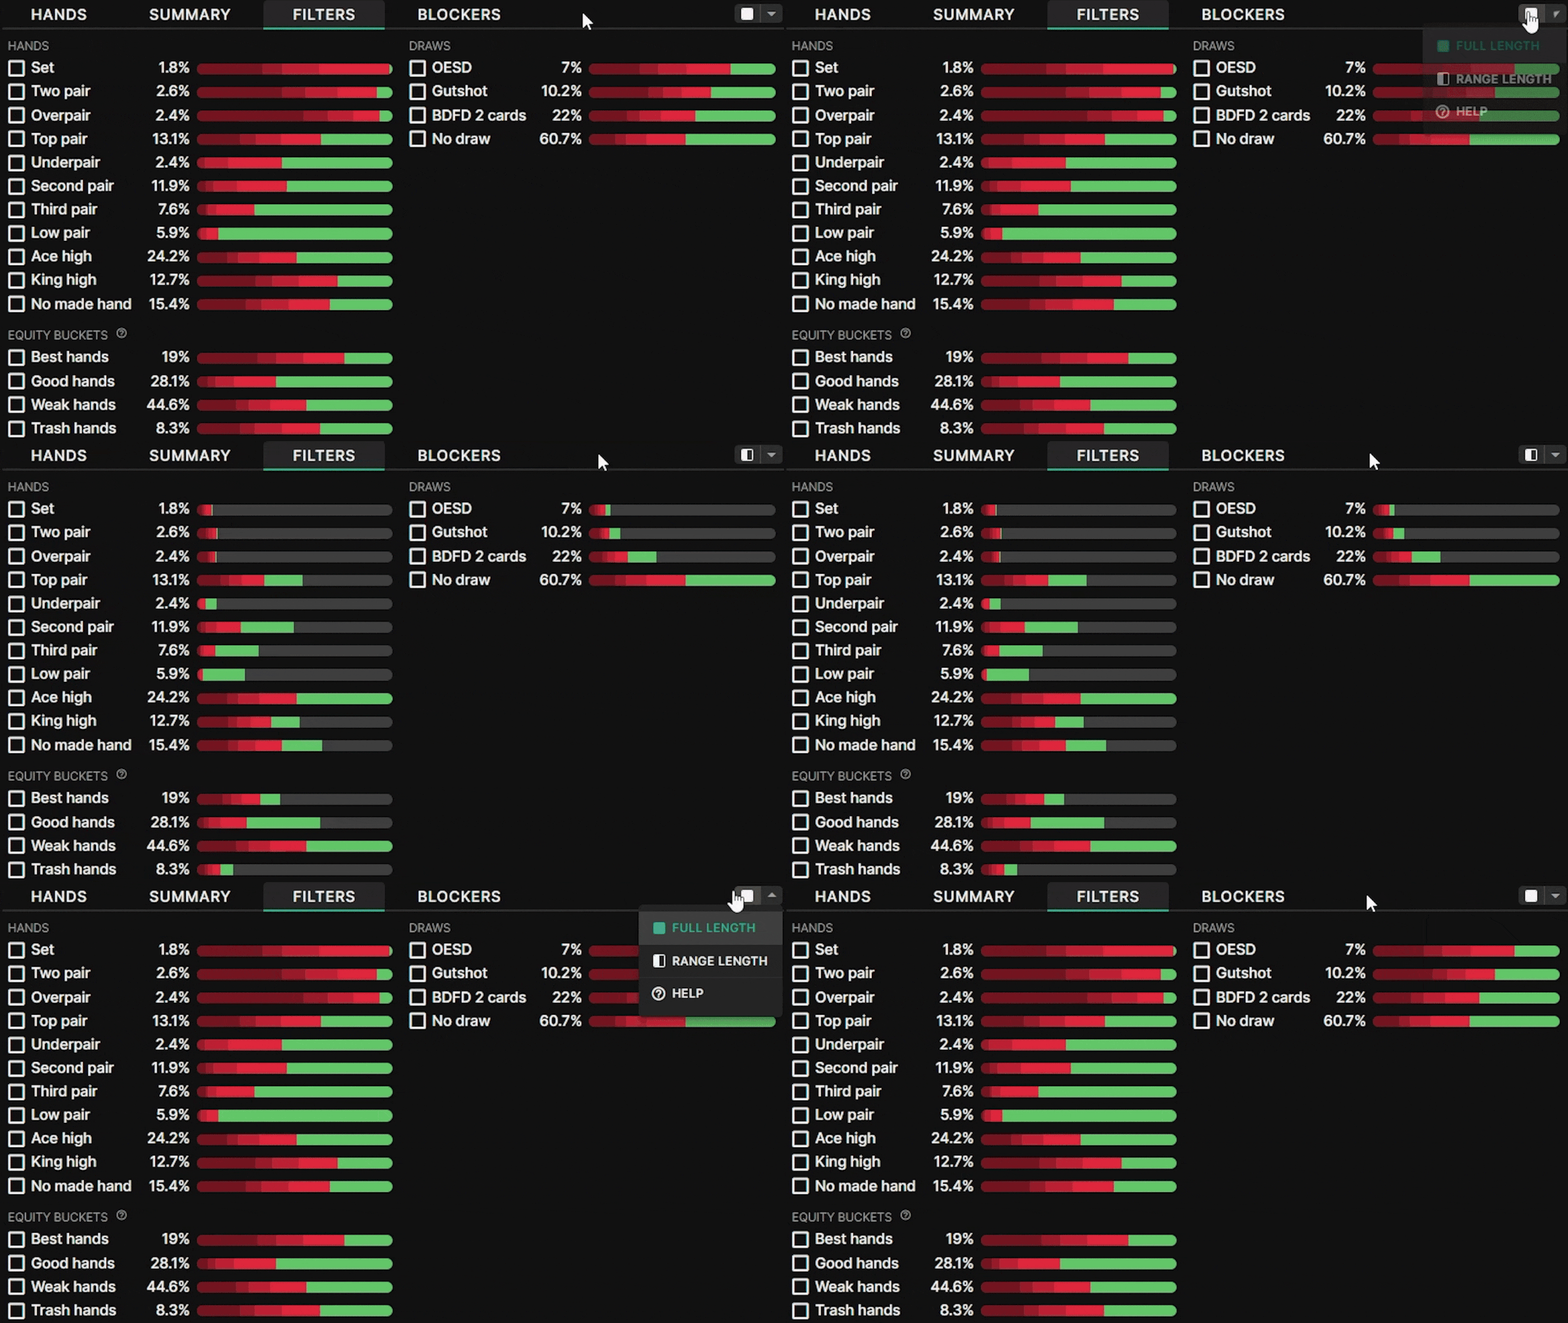
You can change the way you visualize hand categories in the Filters tab! Select the icon in the top-right corner of the Filters tab to switch between Range Length and Full Length.
Range length will rescale the horizontal graphs according to their frequency within your range. This feature helps you visualize the proportional weight of each hand category. Full length scales each hand category to 100% length.
Suit filters
Select the dropdown in the top right corner of the Strategy matrix to access Suit filters. From here, you can apply filters to include or exclude particular suits from your range. These combine with other filters.
The top row filters the highest card, whereas the bottom row filters the lowest card. For example, the above filter would include A♥J♠, and exclude A♠J♥. As always, these filters update frequencies in the Actions table as well as the Summary and Ranges tab.
Bet filters
Selecting any of the actions within the Action table will filter for hands that take those actions. You can select multiple actions even if they are grouped together.

Clear filters
Select the CLEAR button on the right to clear all active filters (or hotkey P).
Alternatively, you can remove filters one at a time by pressing the “x”.

Range views
Select the dropdown at the top-right corner of the Strategy matrix to select a different Range view.
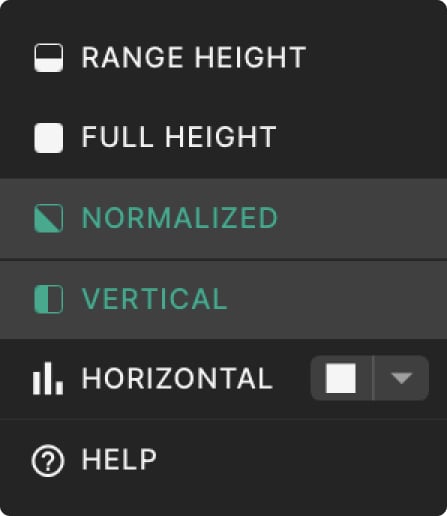
This menu allows you to change the way you view the range. The Range height / Full height / Normalized options are used to rescale hands in your range according to their weight. Horizontal mode provides additional detail by showing you each combination separately within the Strategy matrix.
Poker Metrics – EV, EQ, EQR, Range Weights
Strategy Tab: Use this dropdown on the Strategy tab to view different kinds of data such as strategy, EV, Equity, and Equity Realization.
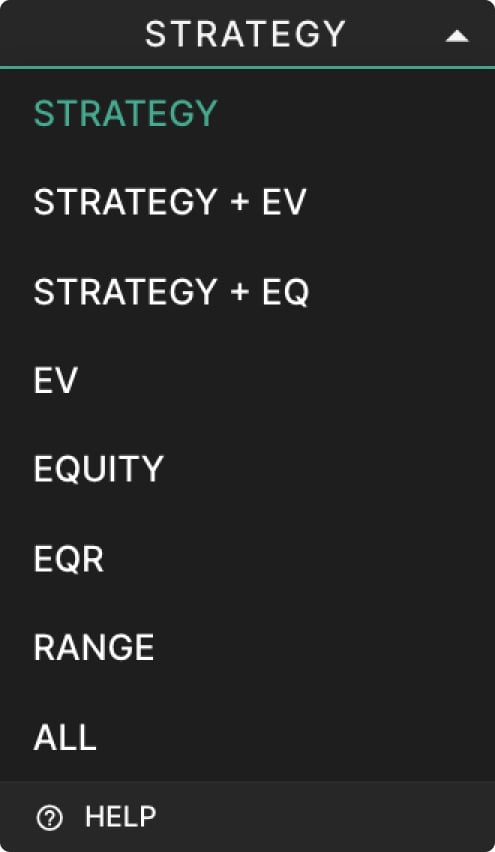
- Strategy – Shows the frequency that hands take different actions.
- Strategy + EV – Shows the color-coded strategy with EV of each action instead of the frequency.
- Strategy + EQ – Shows the color-coded strategy with EQ of each action instead of the frequency.
- EV – Shows the expected value of all combinations and actions. EV is your average expected return for a given hand or action. e.g. for a coinflip with a $1 price, your EV is $0.50.
- Compare EV – Compare the expected value of one action against another.
- Equity – Shows the equity of each combination. Equity is the percentage of the pot you’ll win if a hand is checked down.
- EQR – Shows the Equity Realization of each hand. Equity Realization shows how well a hand performs relative to its raw equity. EQR is calculated by comparing the EV and EQ of a hand. e.g. if a hand expects to win 75% of the pot according to EV, and 50% of the pot according to EQ, then its EQR is 75%/50% = 150%
- Range – Shows the weight of each combination. If you only have a particular hand half the time it will show up as 0.5.
- All – Shows all of the above at the same time.
Compare EV
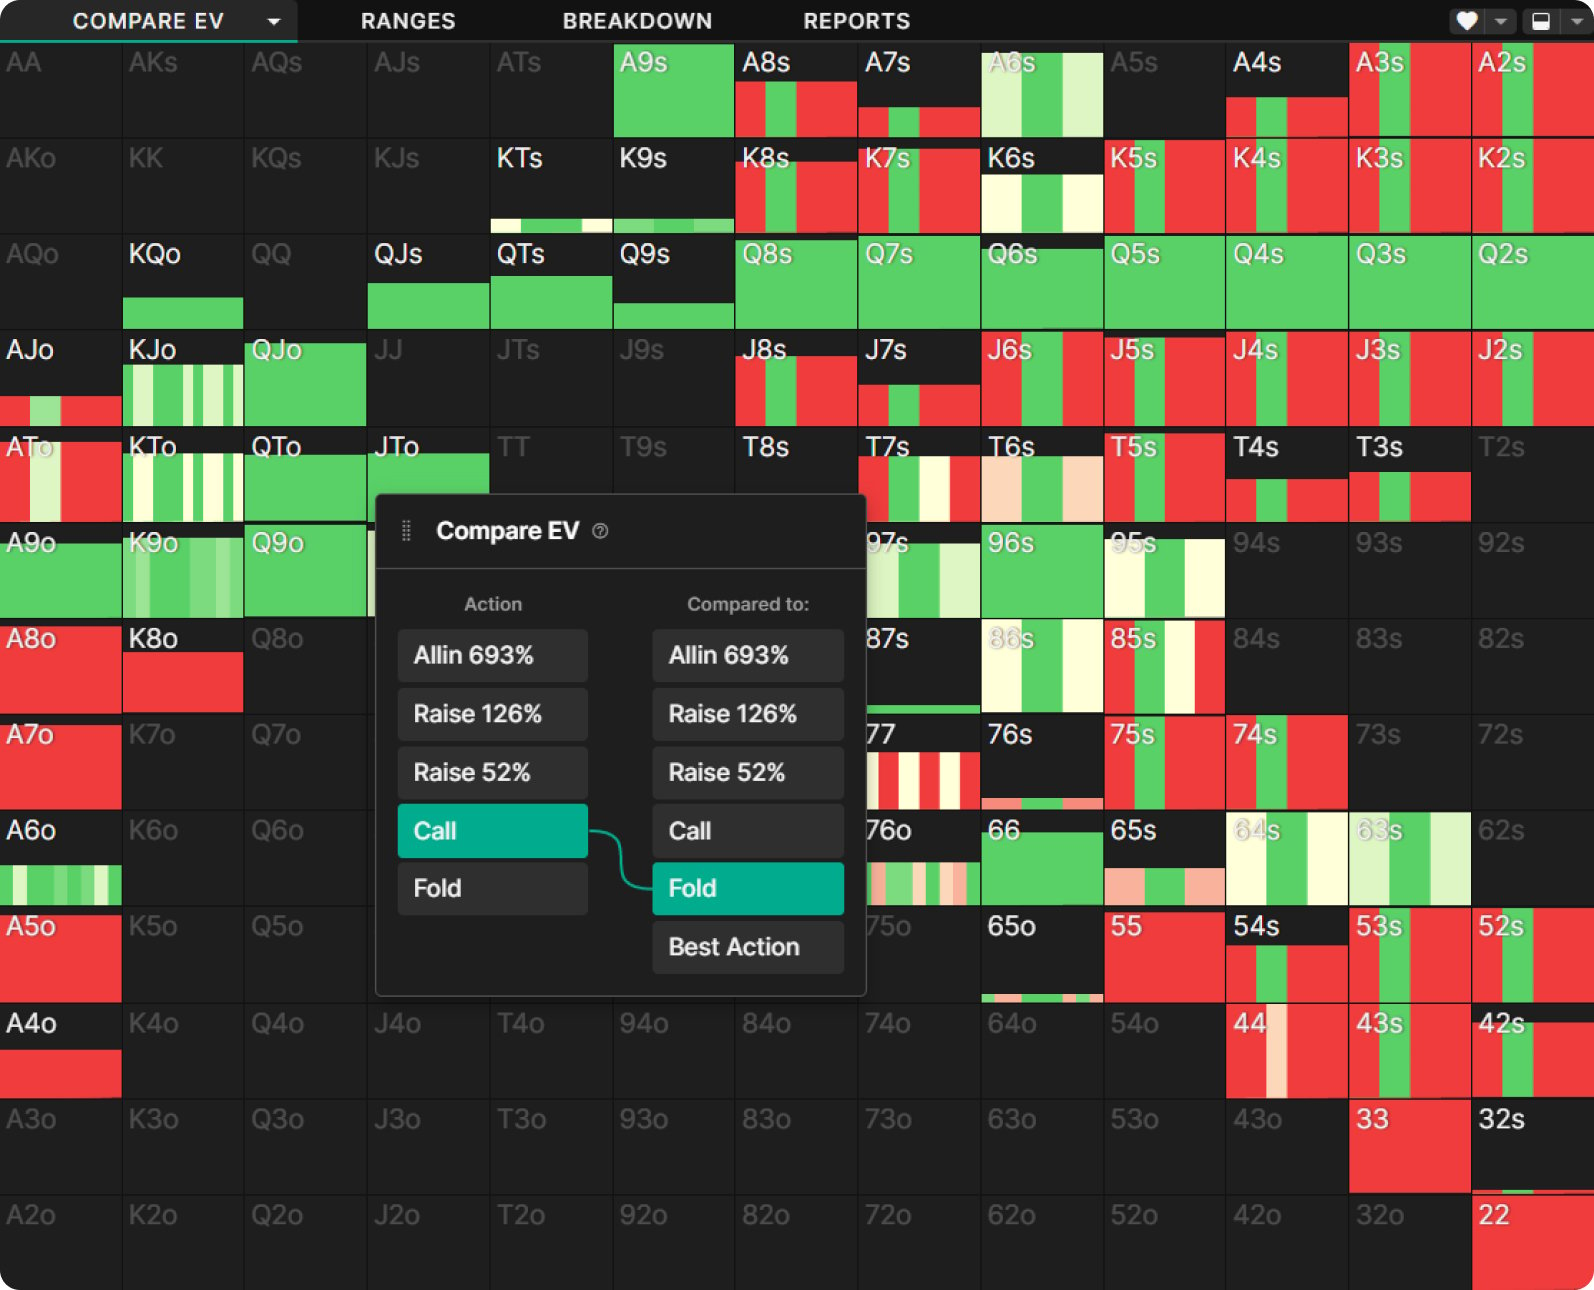
The EV comparison feature is a powerful tool you can access in the Study mode to understand how different hands in your range prefer to play! You can access this feature in the strategy dropdown menu of the Study mode. This function compares the expected value of two decisions and color-codes your range to display which hands are close, and which strongly prefer one action over the other.
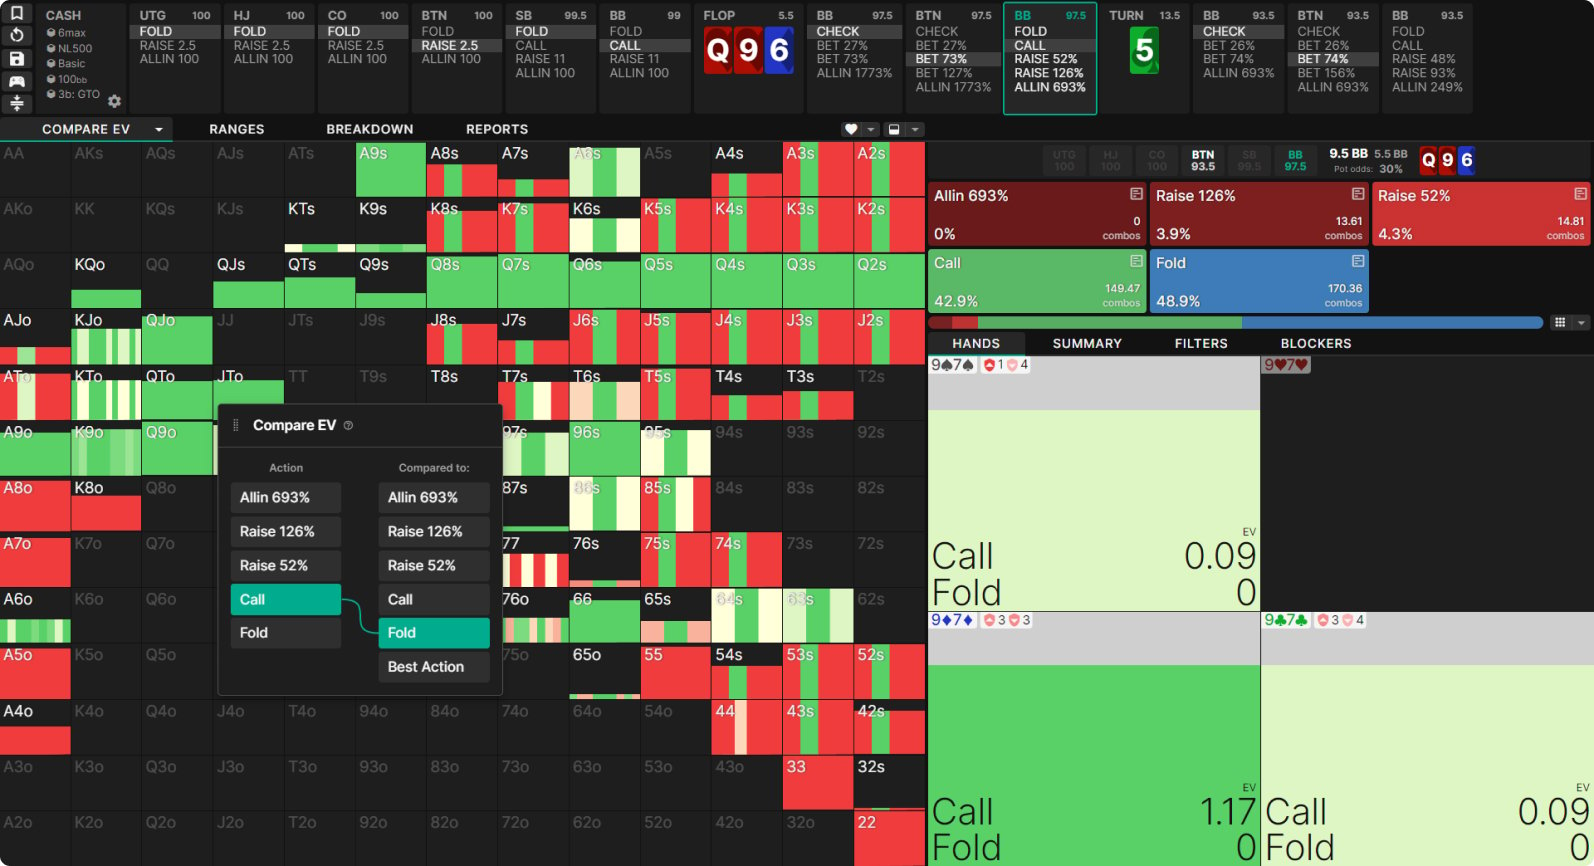
For example, in the above settings, I’ve chosen to compare “Call” and Fold”. Hands that have higher EV as a call are shown in green. Hands that have higher EV as a fold are shown in Red. Hands that are very close to the same EV are shown in white. You can also choose to compare the “Best Action”. This effectively shows the regret or EV loss of choosing one action against the opponent’s fixed strategy.
For example, on this Q96 board, the BTN has bet 73% pot. We can see at a glance which hands strongly prefer calling (green) over folding (red) and which hands are close (white). Hovering over 97♠ we observe that we should certainly continue when we hold the backdoor diamonds, but without that it’s a very marginal decision. Comparing EV is a great way to study value and continuation thresholds!
Want to learn more about how to get the most out of the EV Comparison tool? Check out this article!
Ranges Tab
Use the Ranges tab to view both players’ ranges simultaneously. This view is best for comparing and contrasting different sections of the ranges.
- View and filter by equity buckets
- View and filter by hand classes
- Copy ranges in Pio/GTO+ format. You can copy the entire range or the ranges of particular actions
- View the equity graph
Click here to learn more about the Ranges tab.
Breakdown Tab
This is used to break down how actions within your range are constructed.
- Compare the range composition of different actions
- View the strategy of various hand categories within your range
- View your strategy along with the equity distribution of your range
Click here to learn more about the Breakdown tab.
Reports Tab
The Reports tab shows you aggregate flop or turn reports for the spot you selected. These reports contain data about every flop, (or every turn card within a flop). This function is used to research deeper trends in the GTO strategy.
Click here to learn more about aggregate reports.
Customization
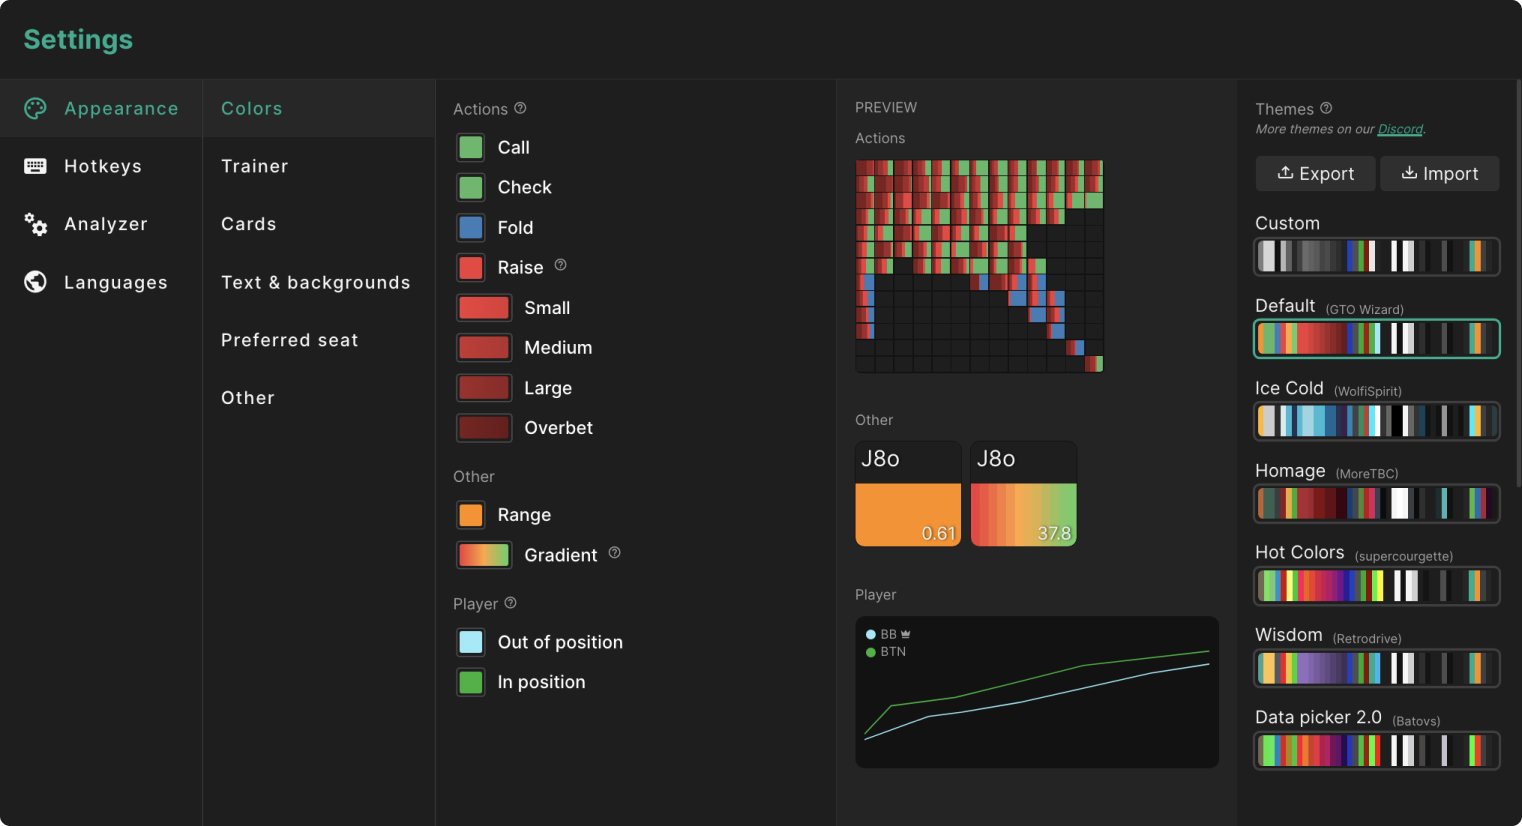
This menu allows you to change the look and feel of GTO Wizard. You can customize your colors with preset themes, or create your own theme.
GTO Wizard the #1 App for Poker players


