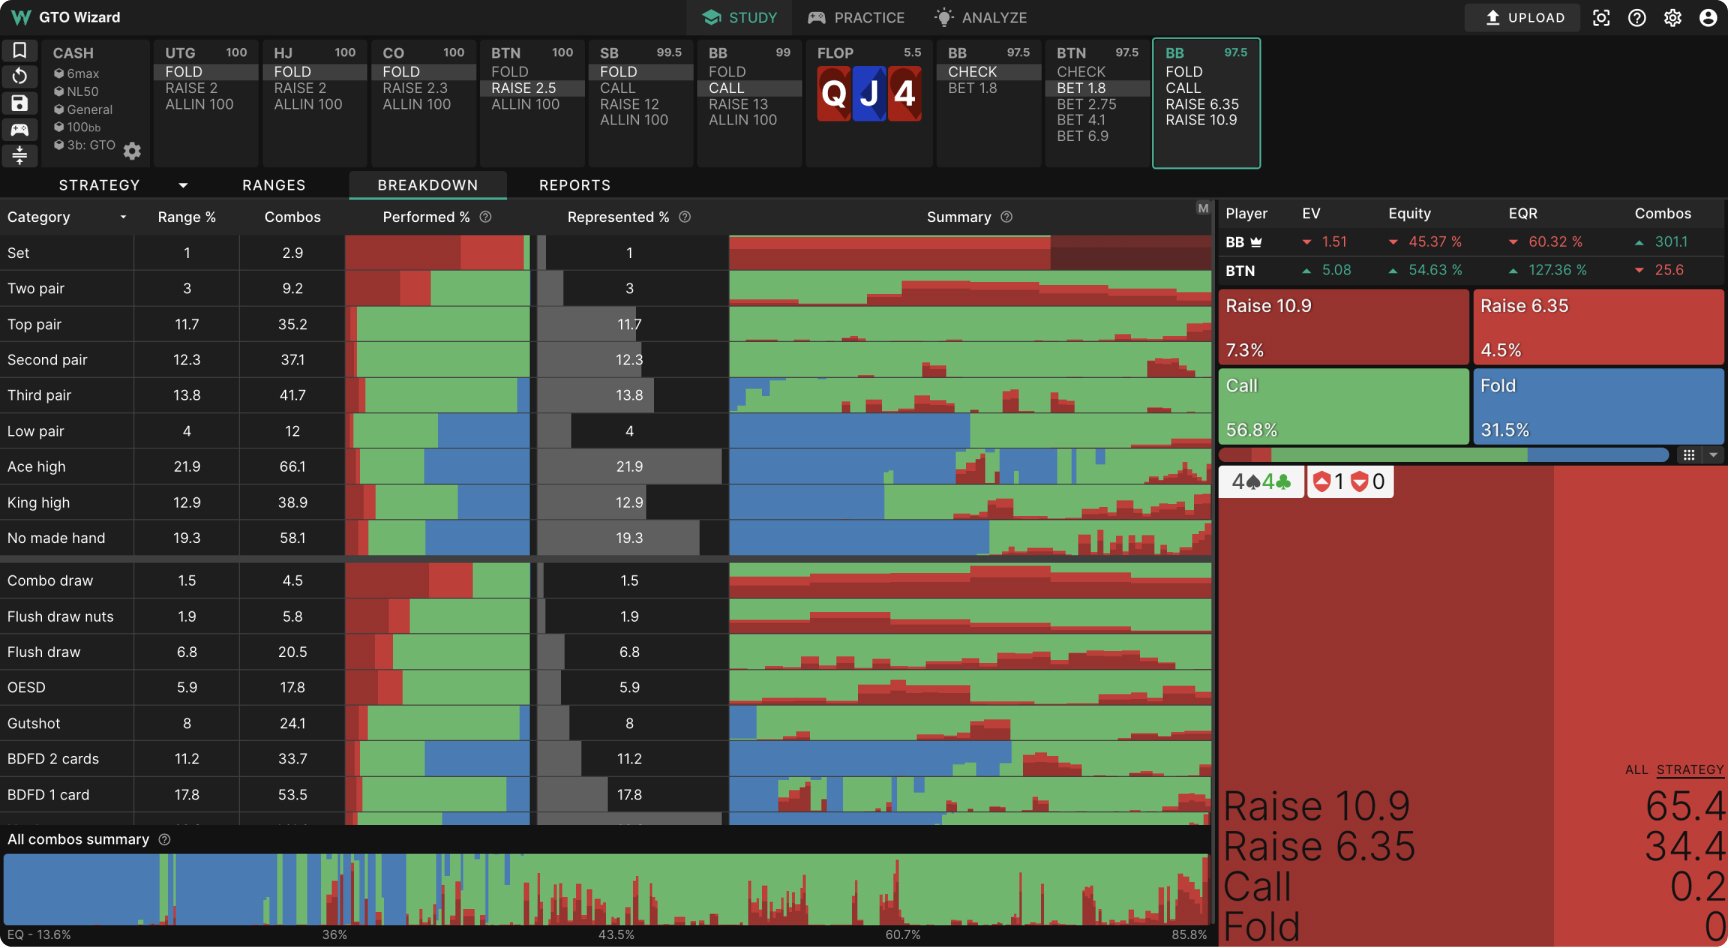
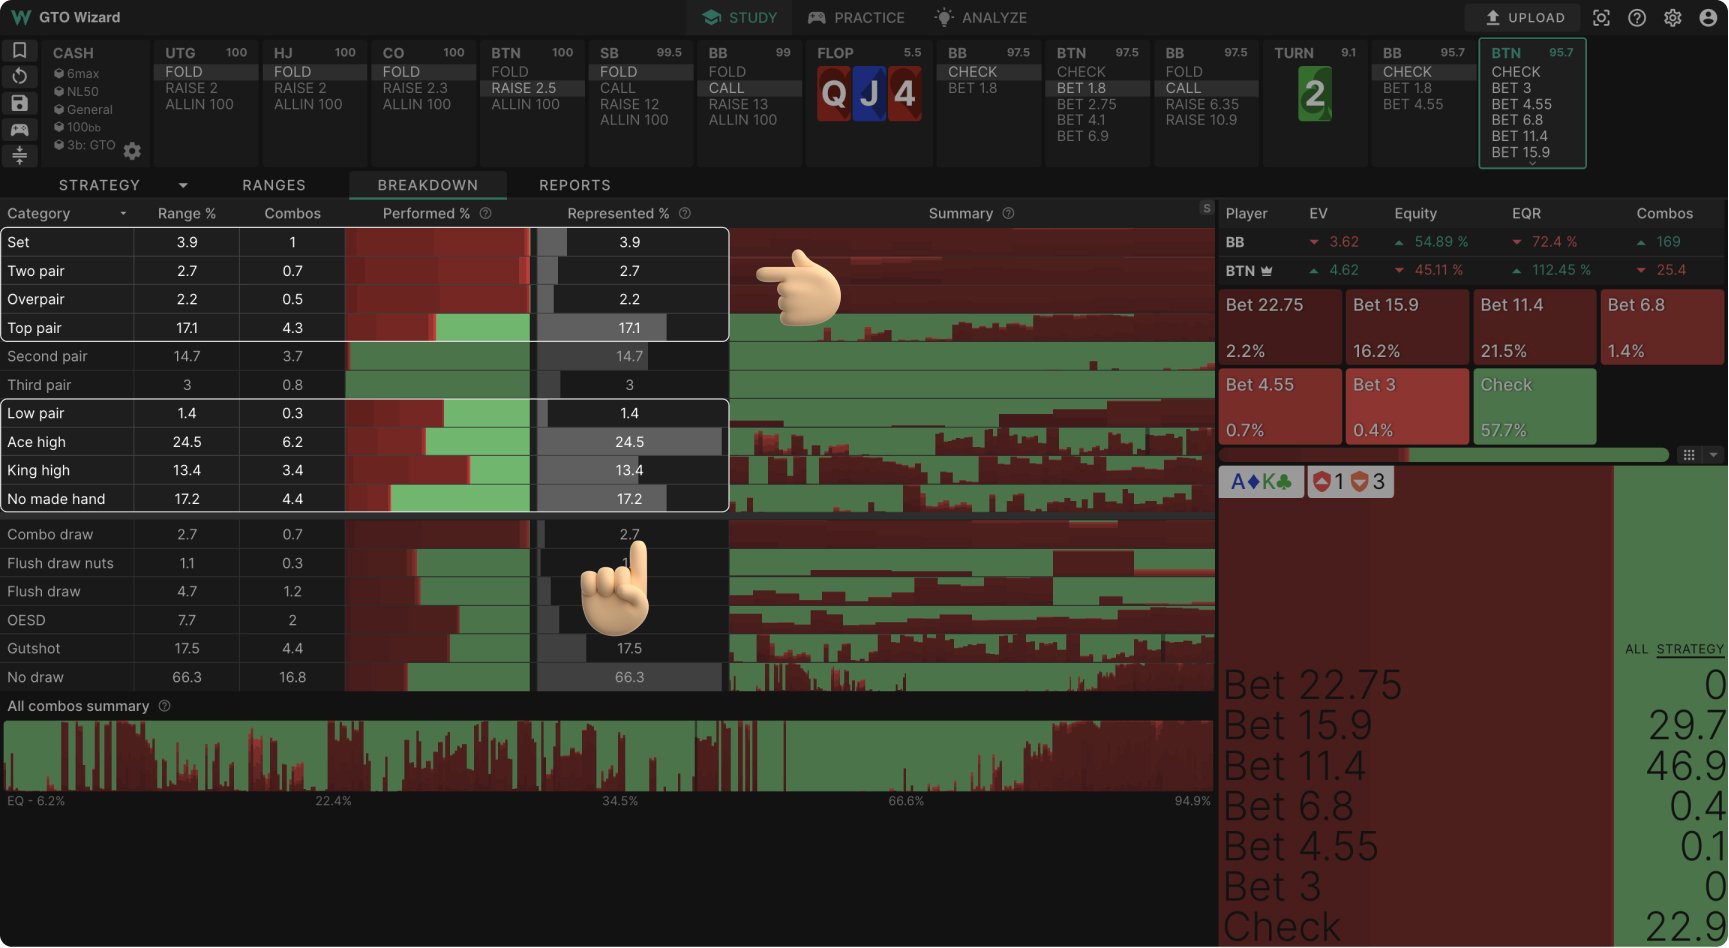
Breakdown Tab
The Breakdown tab helps you construct your ranges and dissect your strategy! 🔭 From here you can:
- Learn how to construct ranges within one or multiple bet sizes
- Study how different hand classes behave
- See your strategy across your equity distribution
- Visualize your thresholds, polarity, and strategy
Definitions

- Category
Hand category - Range%
The number of combinations within each category divided by the total number of combinations within your range - Performed%
The probability that each category performs the selected action(s) - Represented%
The portion of each category that makes up the range within your selected action(s) - Summary
Manhattan plot of all combos and their strategies within a category, sorted by equity - All combos summary
Manhattan plot of all combos and their strategies within your total, unfiltered range, sorted by equity
Range Construction
Select one or multiple actions to update the breakdown tab. This gives insight into how different parts of your strategy are constructed. For example, I have selected both 175% and 125% overbets on the turn.
We can see that this grouped range is constructed using top pair+ for value, and about 59% of the overbetting range are bluffs.
Hand Class Strategy
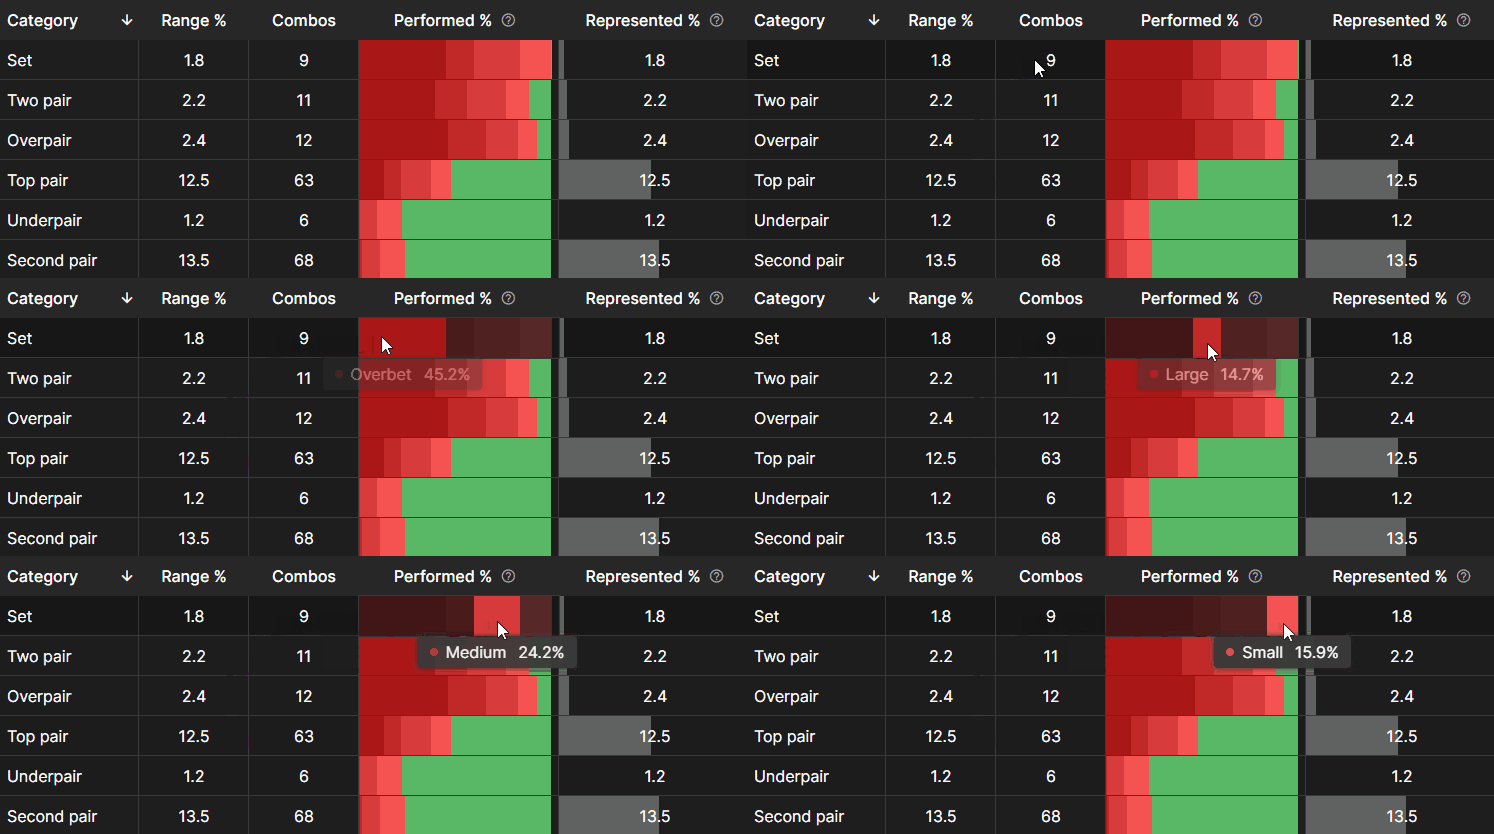
Simply hover over the “Performed%” to see how different categories prefer to play.
Summary Graphs
The summary graphs consist of Manhattan plots. These display every hand’s strategy, sorted by equity.
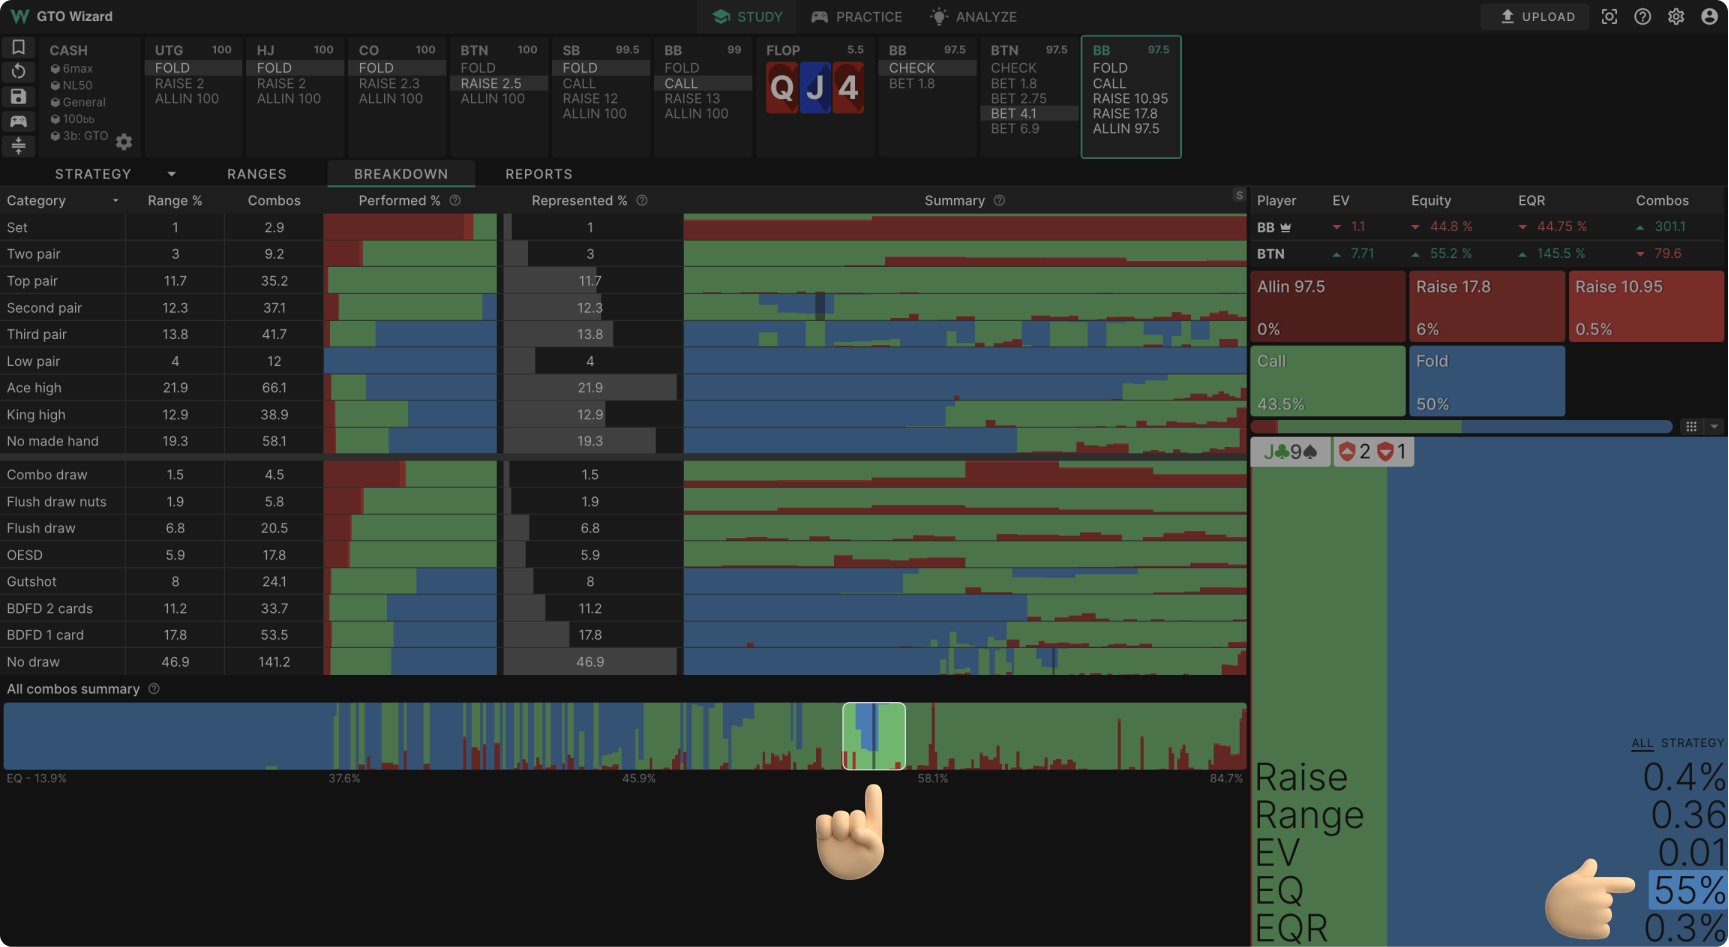
The All Combos Summary graph at the bottom plots every hand in your range, sorted by equity. This graph is great for quickly visualizing the strategy, polarity, implied odds, and thresholds. For example, facing this 75% bet on the flop, BB is folding hands like J9o with 55% equity, and calling hands like K9o with 38% equity. This is due to J9 being a dominated pair, while K9 draws to the nuts, giving it better implied odds.
Tips
- Click on any one of the columns to sort them
- Hover over any summaries to see an expanded graph, and scroll through each combination in that category
- Group similar bet sizes together by pressing “S”
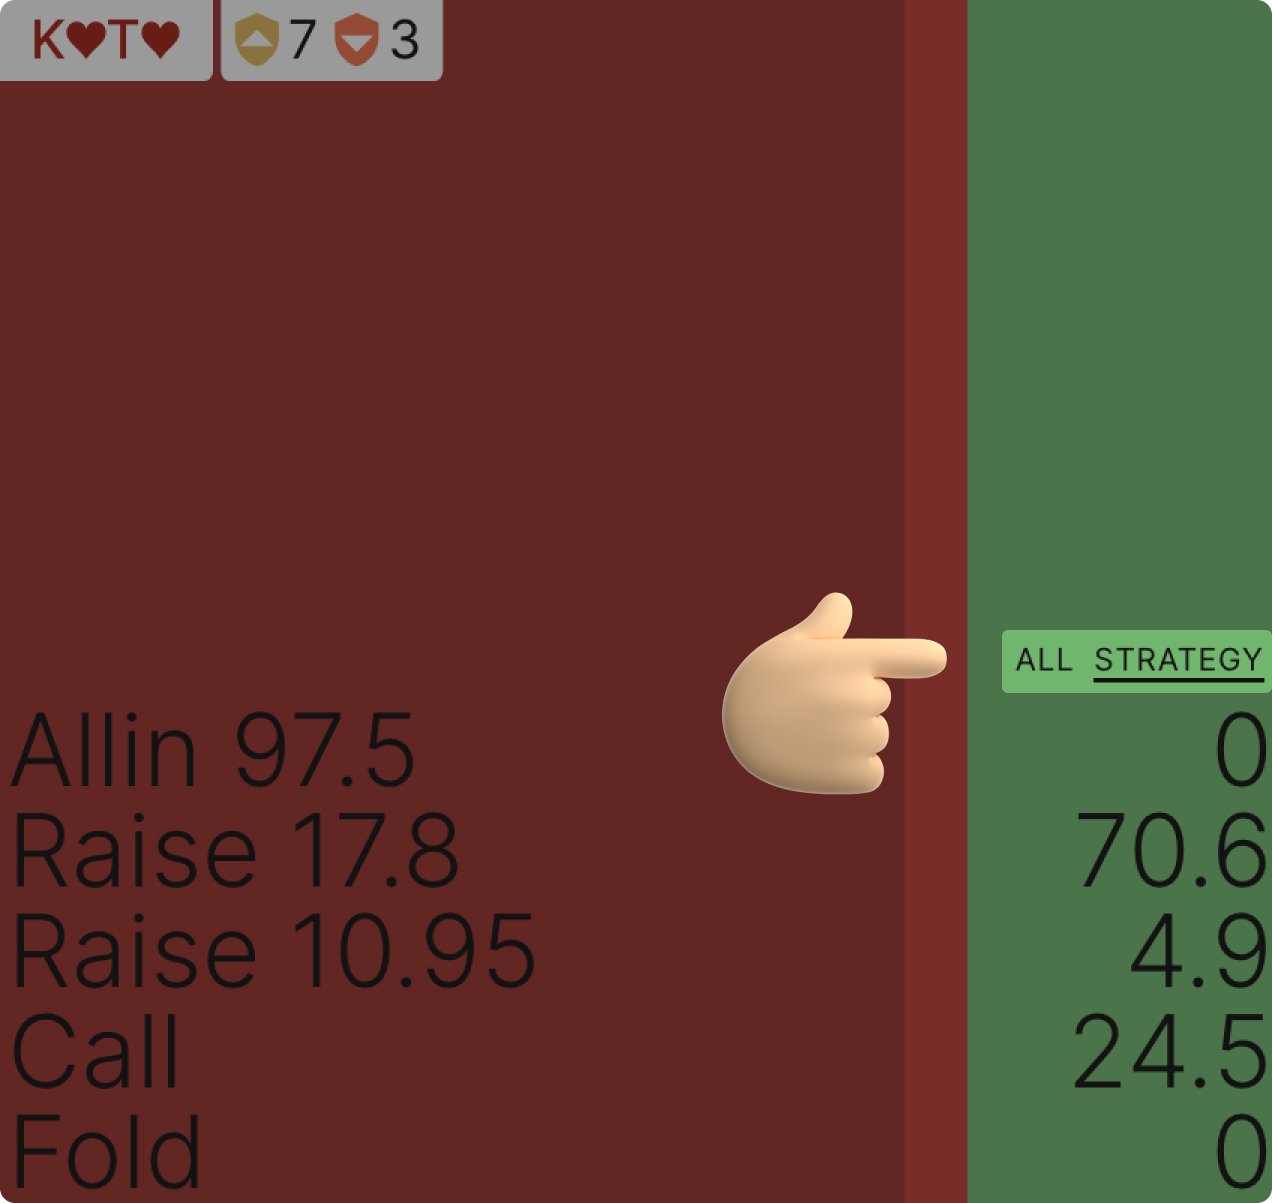
- Toggle between “Strategy” and “All” in the bottom right corner to display action frequencies or information like equity and EV.
GTO Wizard the #1 App for Poker players
