Aggregate Reports
Aggregate Flop Reports Overview
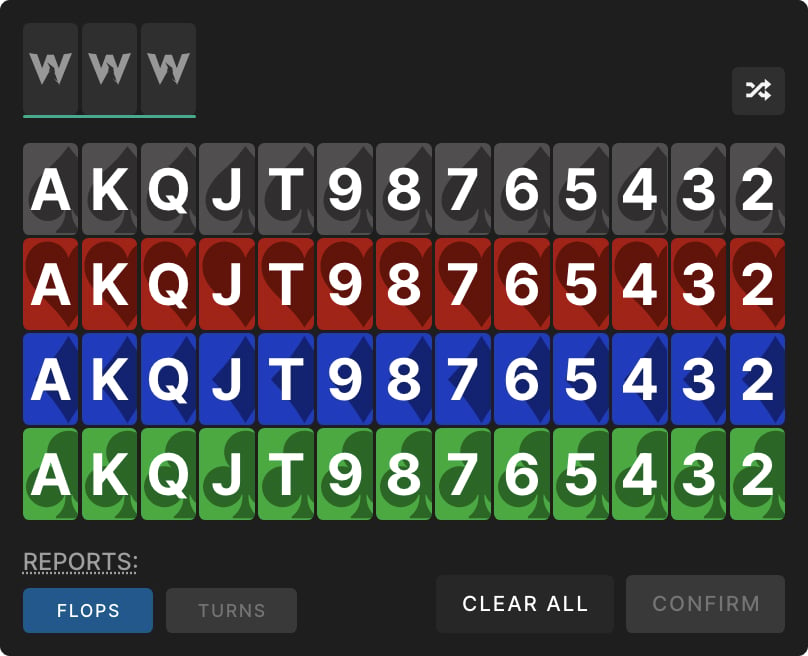
Aggregate Flop Reports are an extremely powerful tool that allows you to find deeper trends in game theory. These reports account for all 1755 strategically different flops and can be accessed from any flop node.
Flop reporting offers several different ways to view the data, including:
- Chart and table views
- Bet size grouping
- Board texture grouping
- Board texture filters
These reports include data about EV, Equity, Equity Realization, and strategy.
By combining various filters and views, you can uncover trends and discover GTO heuristics to make better data-driven decisions.
All flops and filters are weighted according to their actual probability. This means the overall statistics you see for any spot will be correctly weighted when applying filters.
Chart View vs. Table View
You can alternate between chart and table view using the dropdown here (or press ‘W’).
Chart view offers better visualization, whereas table view is better for working with exact numbers, though they both provide similar functionality.
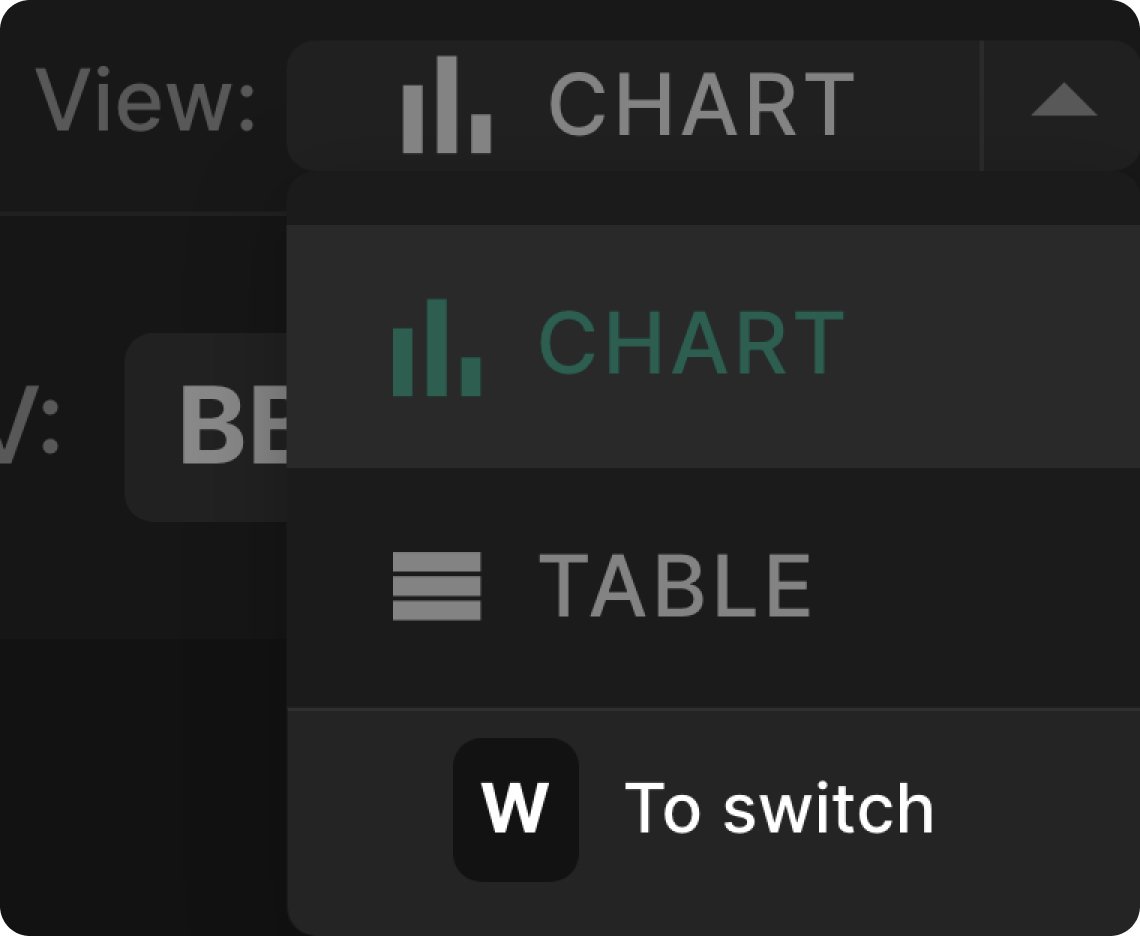
Chart View
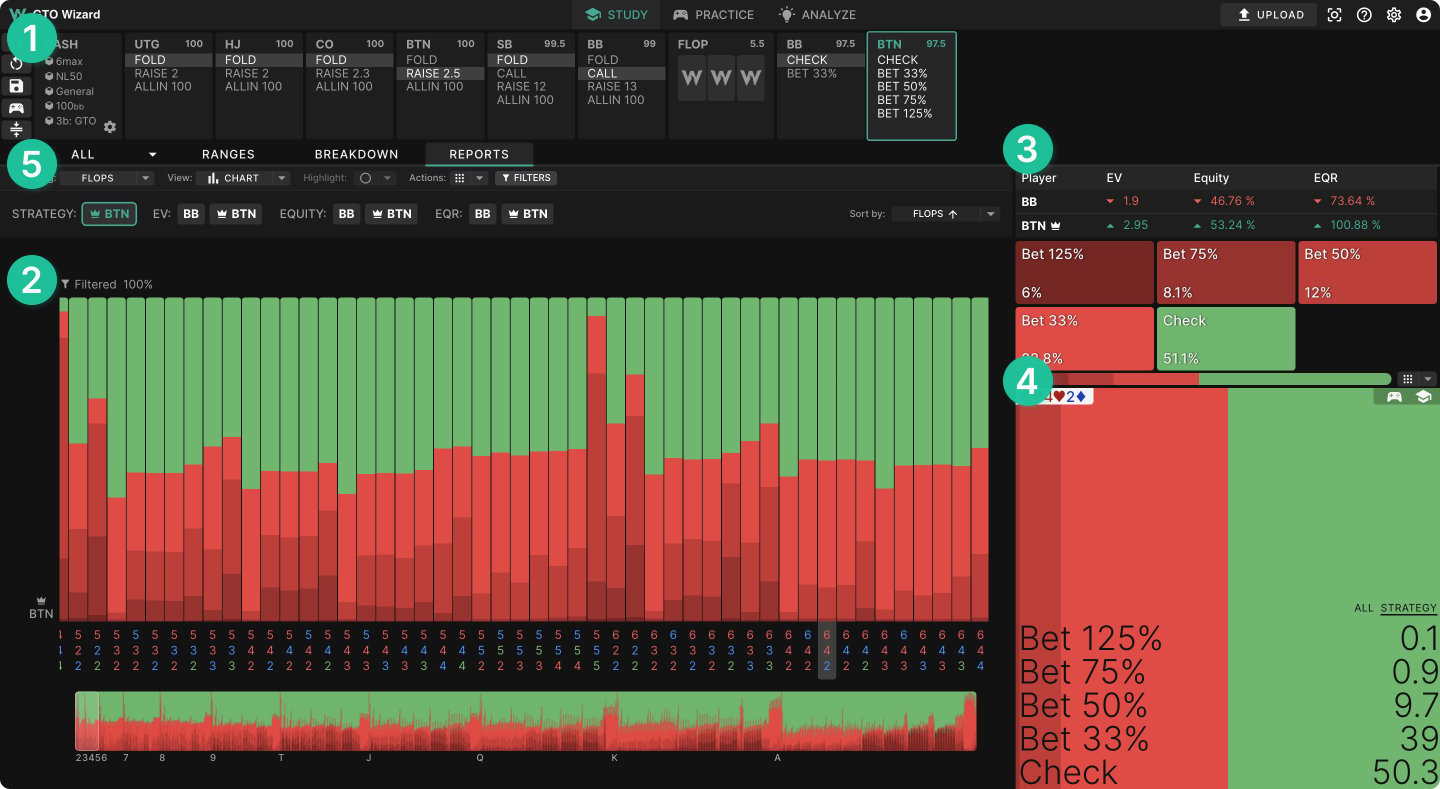
Chart View is the default view and the most aesthetically pleasing way to view the data. All flops are displayed as a bar graph. We can break this up into several categories:
- Spot selector – Select the spot you want to analyze. See the “spot selection” chapter
- Data visualizer – Shows the data you’ve selected for all flops or categories
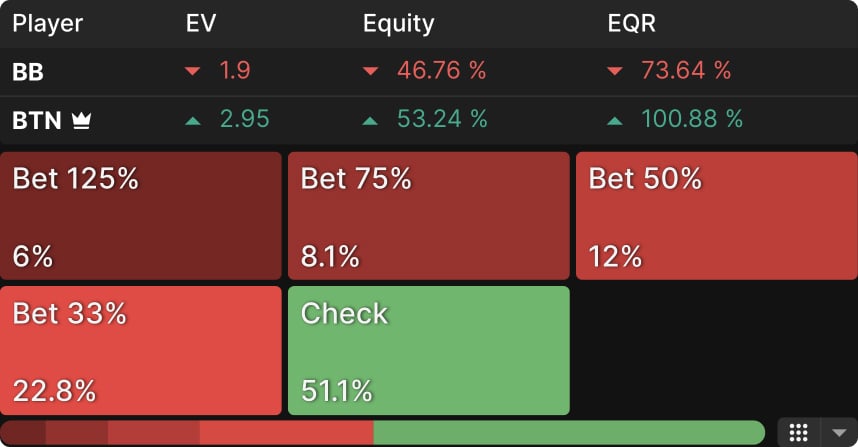
- Overall stats – Shows the overall strategy, EV, equity and EQR for all flops within your filters
- Specific stats – Shows the strategy, EV, Equity, or EQR for one specific flop or group
- Filters and Grouping – This allows you to apply board texture filters, switch data between strategy/EV/EQ/EQR, sort data, group data, and group actions
Data visualizer
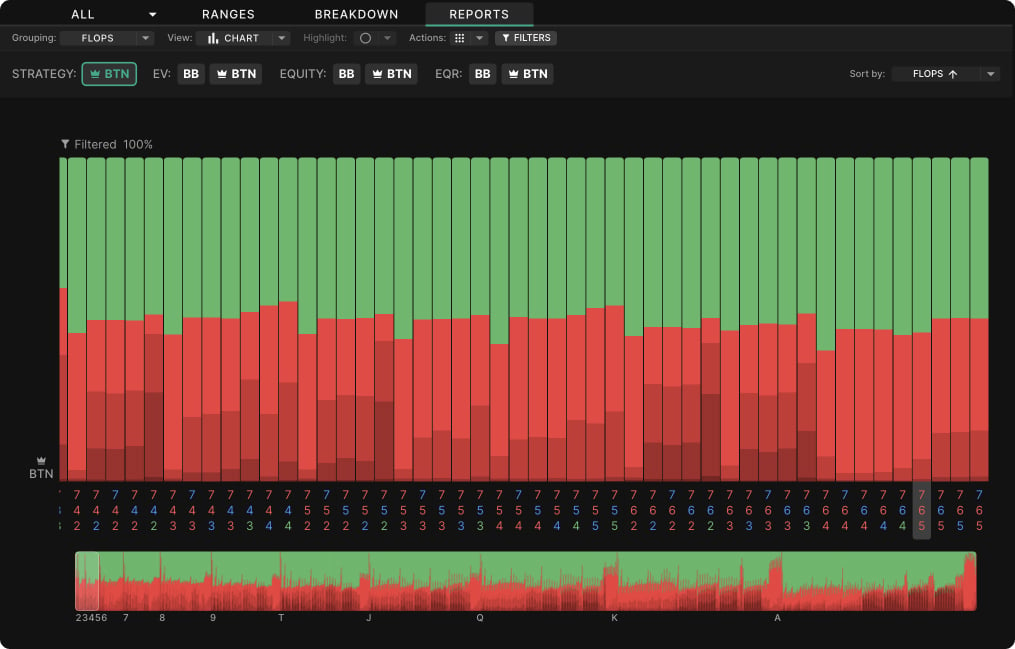
The data visualizer is the primary display of the aggregate reports. The data visualizer shows you the strategy of all flops/categories.
Use the manhattan graph at the bottom of the page to scroll through flops. You can also scroll with the mouse wheel.
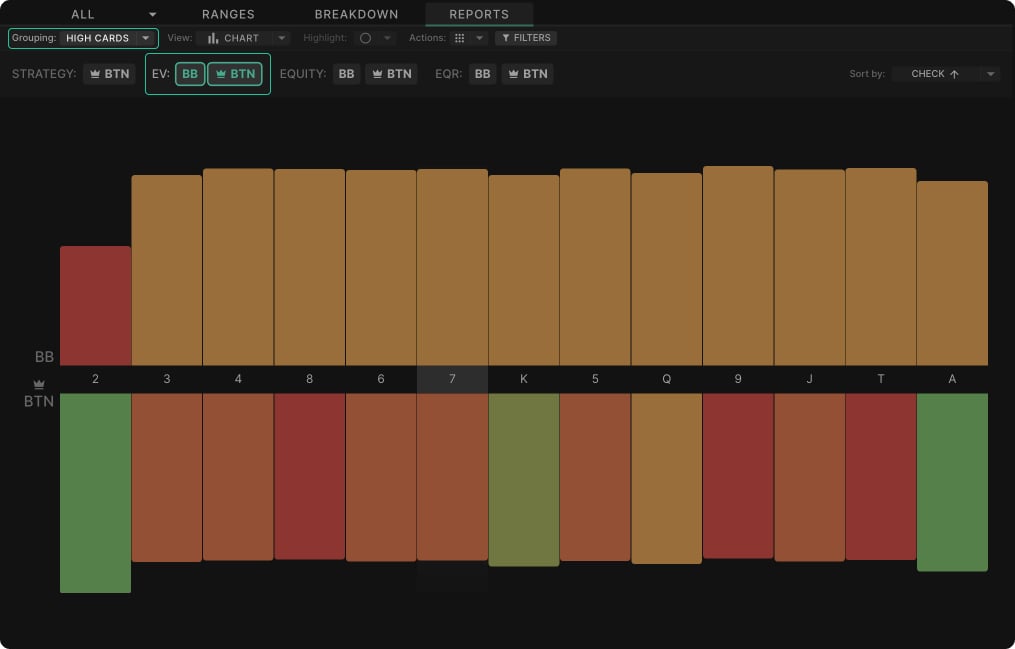
Use the buttons at the top to view the Strategy/EV/EQ/EQR of flops or groups. Selecting both positions’ EV/EQ/EQR will show a double bar graph.
Overall stats
This section shows you the average stats for all flops within your filtering criteria.
Selecting one or multiple bet sizes will update the data visualizer only to show those actions.
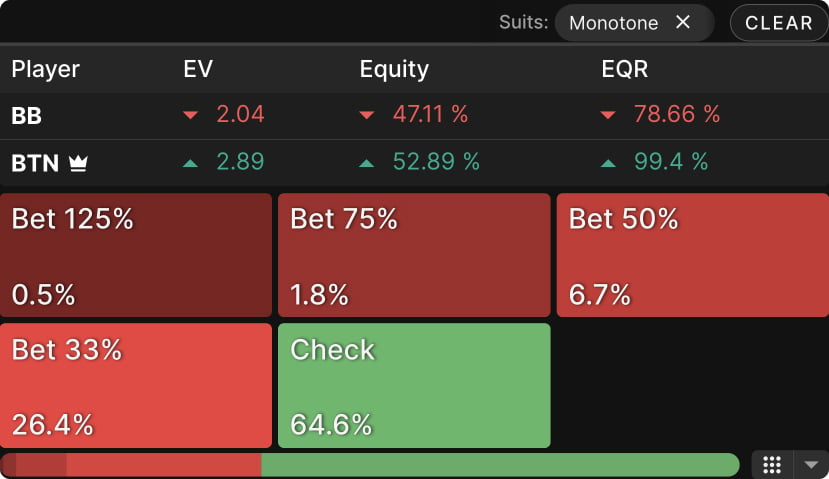
Applying filters will update this data. For example, using the filter “monotone” results in this:
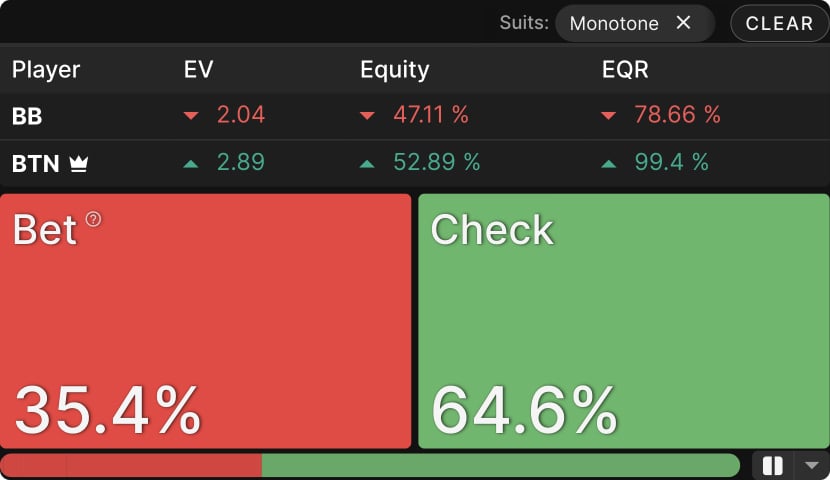
We can also group similar actions together using the dropdown in the bottom right corner, (or simply press ‘S’).
Specific stats
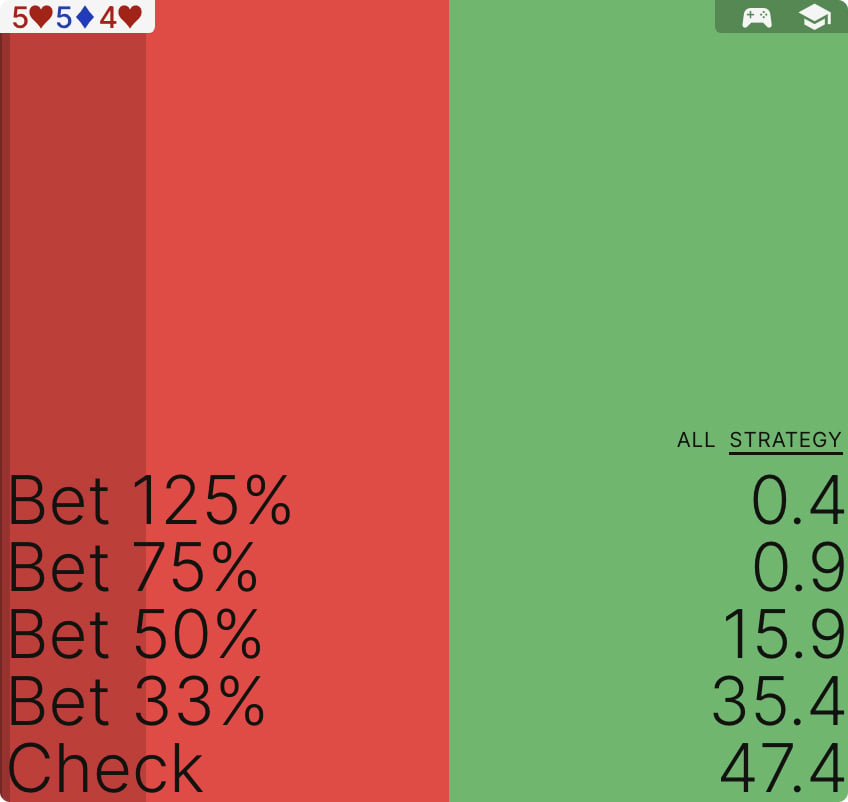
This section shows you specific data for whatever flop/category you’ve selected. You can jump directly to the solution browser or practice mode by selecting the icons in the top-right corner. For example, here we’ve highlighted the A♦K♥J♥ flop and can easily see the overall frequencies without opening the solution.
These stats will update based on whatever data, grouping, or filters you apply.
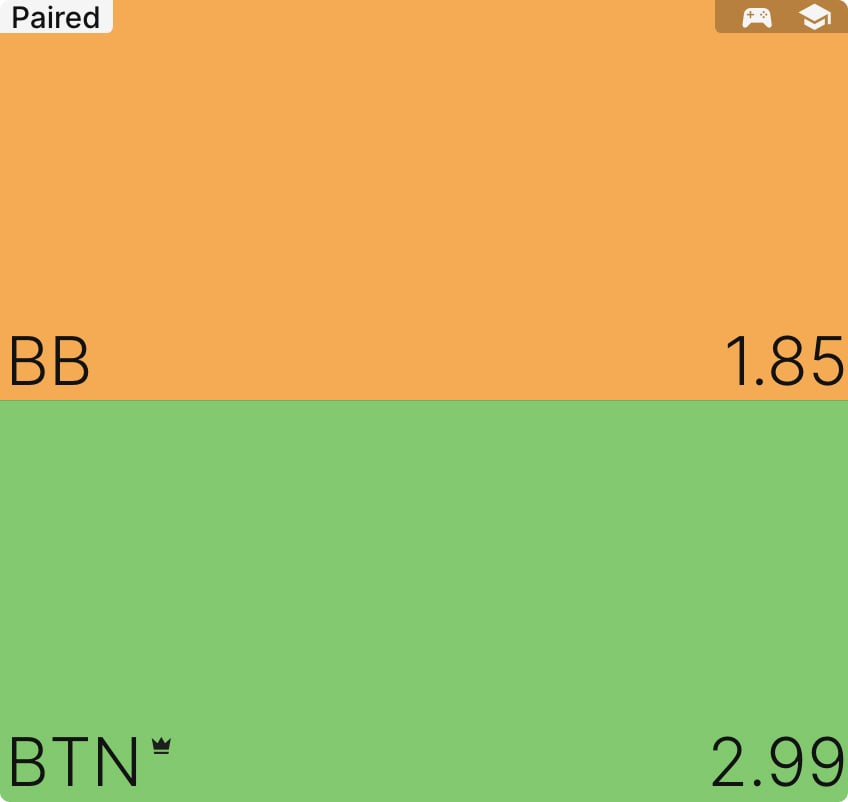
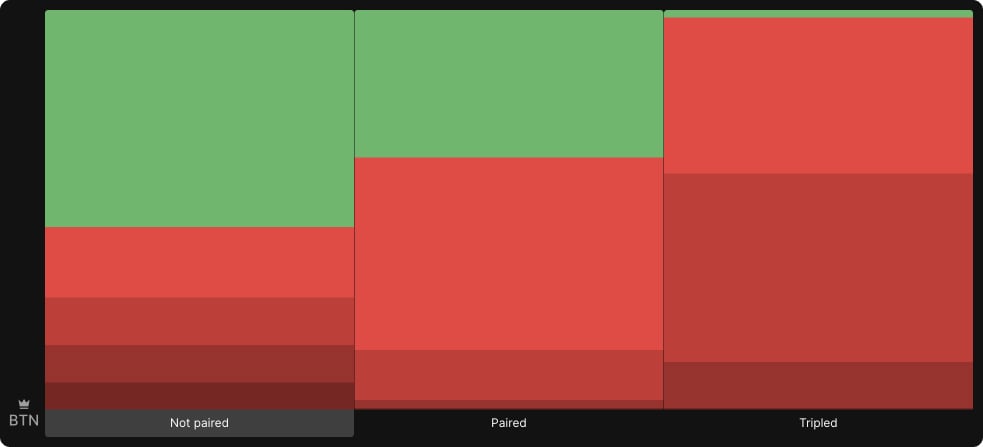
For example, we can view the EV of paired boards by selecting EV and grouping by pairing.
Filters and Grouping
Filters and Grouping allow you to apply board texture filters, switch data between strategy/EV/EQ/EQR, sort data, group data, and group actions.
Filtering
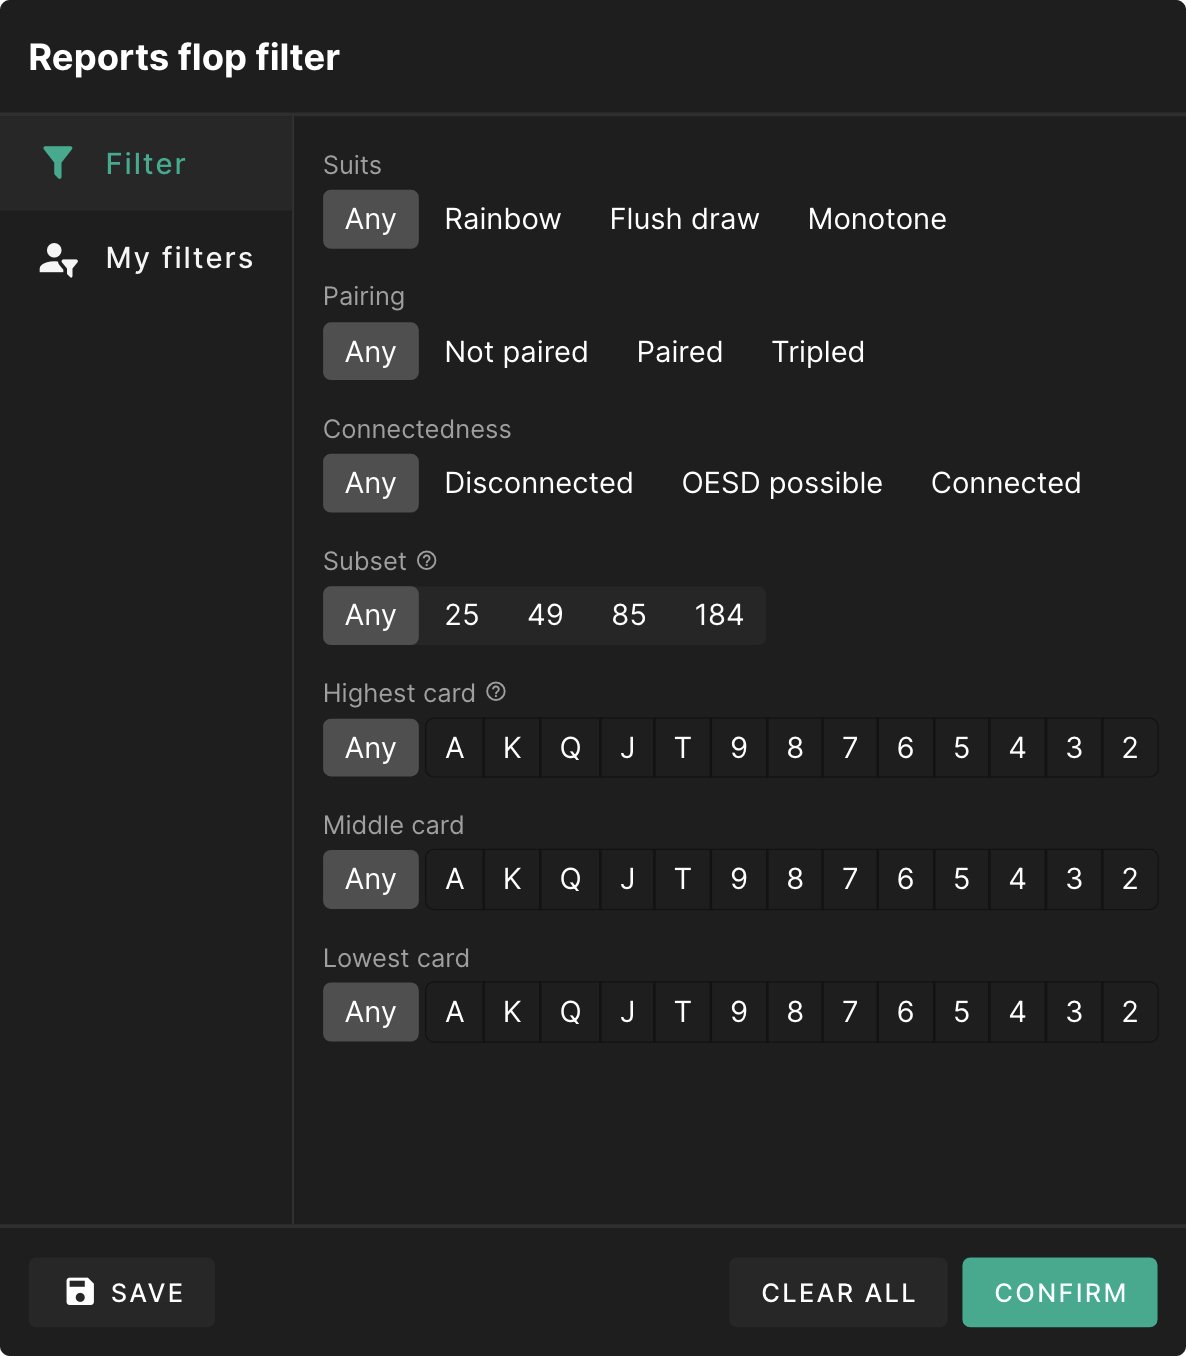
Filtering works the same way here as the rest of GTO Wizard. Filters will update data across the entire report. You can combine multiple filters to increase precision. Filters are one of the most powerful tools in reports! Use them to determine heuristics and break down strategies by texture. Filters are especially powerful when combined with other functions like sorting and grouping.
You can save filters and access them later by selecting “my filters”. We recommend saving filtres that create strategically similar flops.
Subsets
Subsets are collections of flops that are chosen to represent the full space of all possible flops. Use subsets to simplify reports and make studying trends simpler. Learn more about how subsets are calculated here.
Grouping Flops
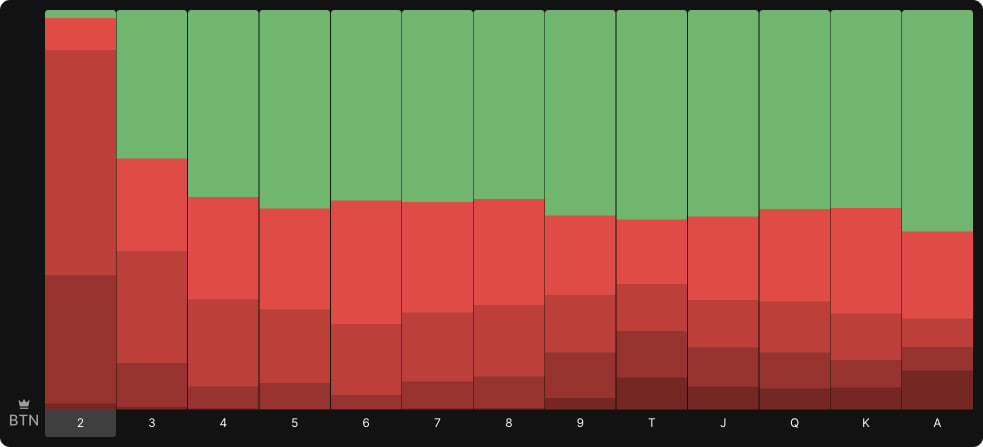
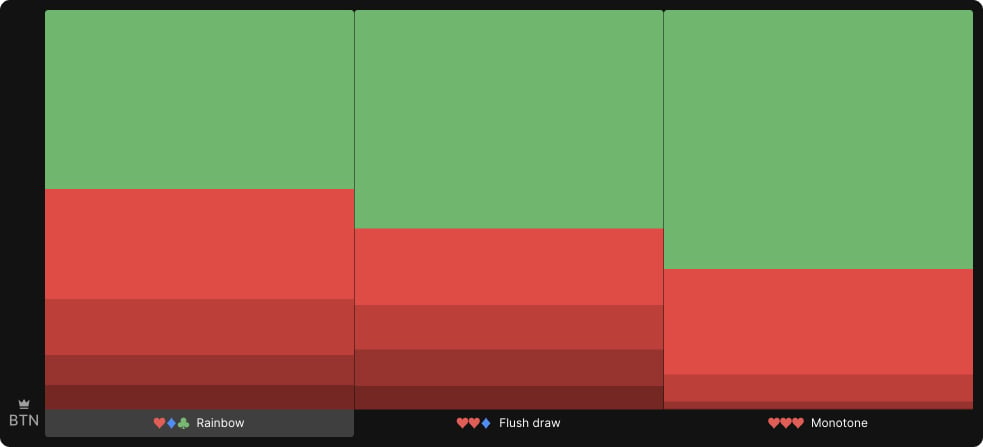
One of the best tools in the chart view is the ability to group similar flops together. You can group flops by high card, suits, pairing, and connectedness.
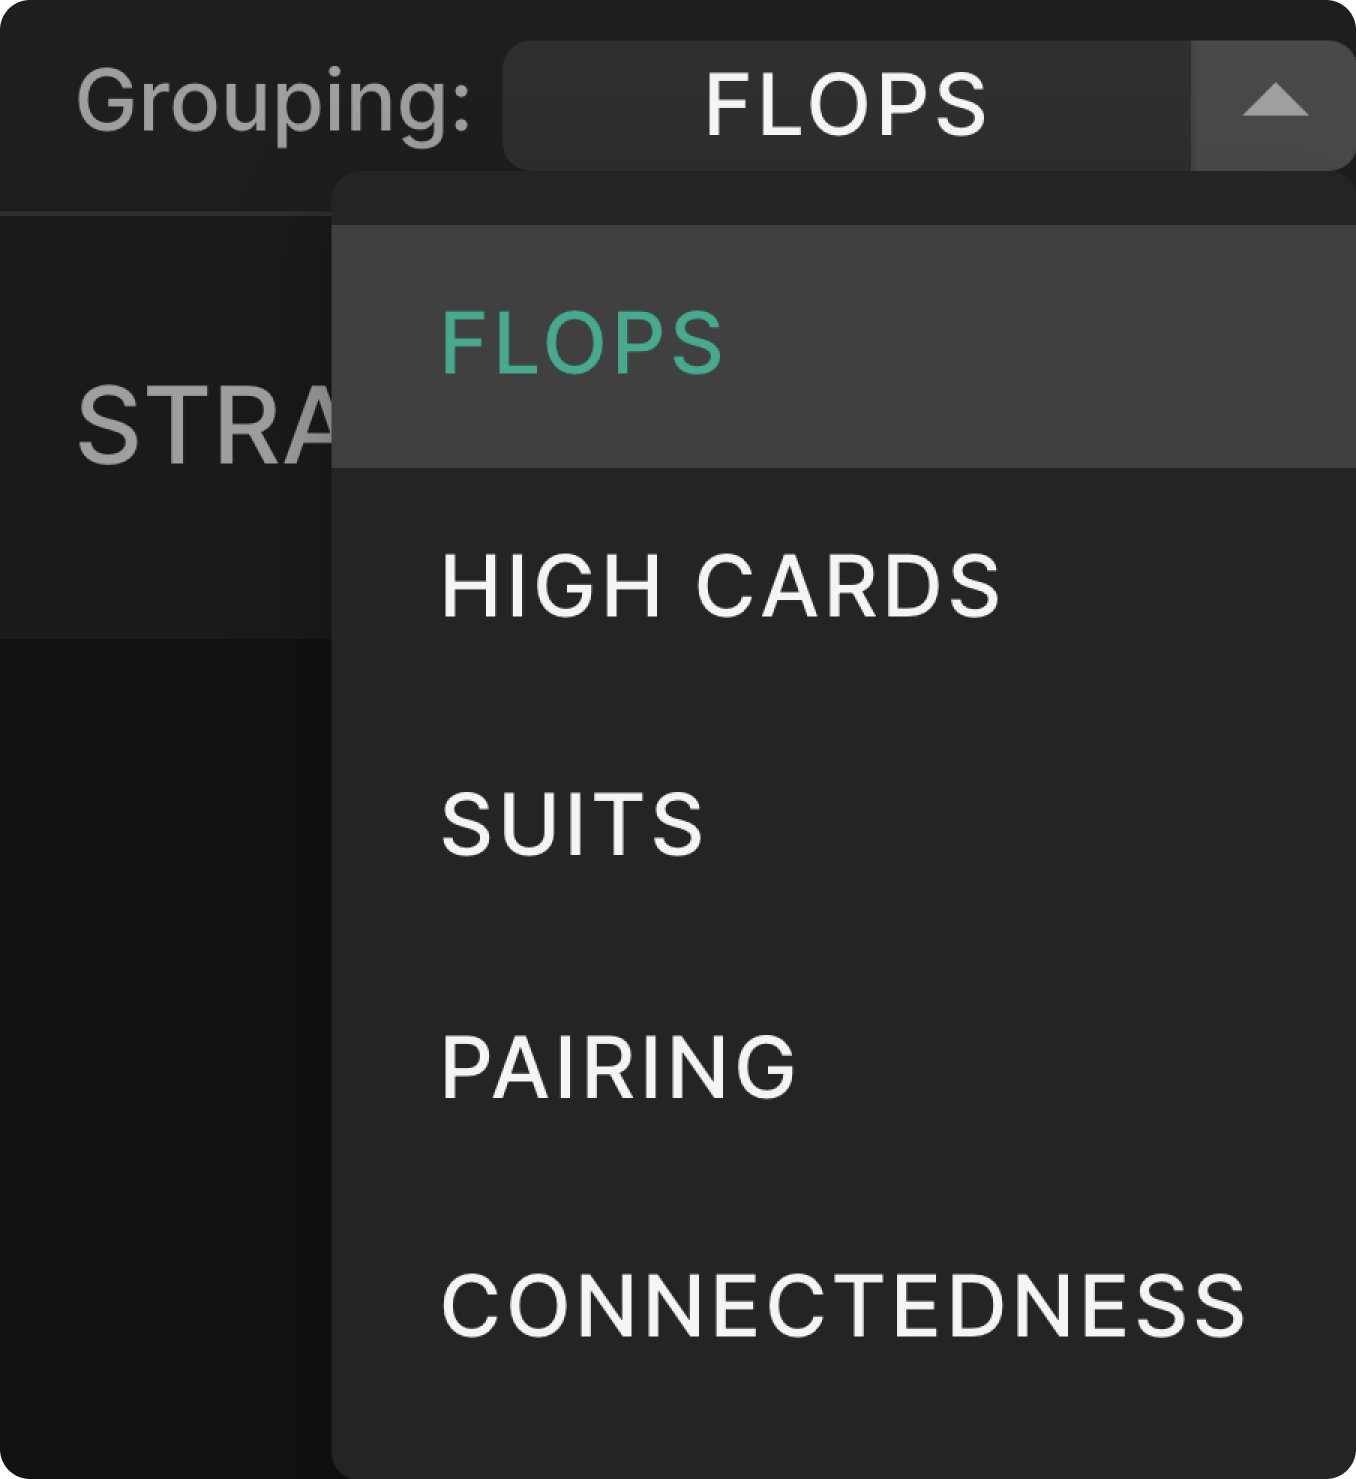
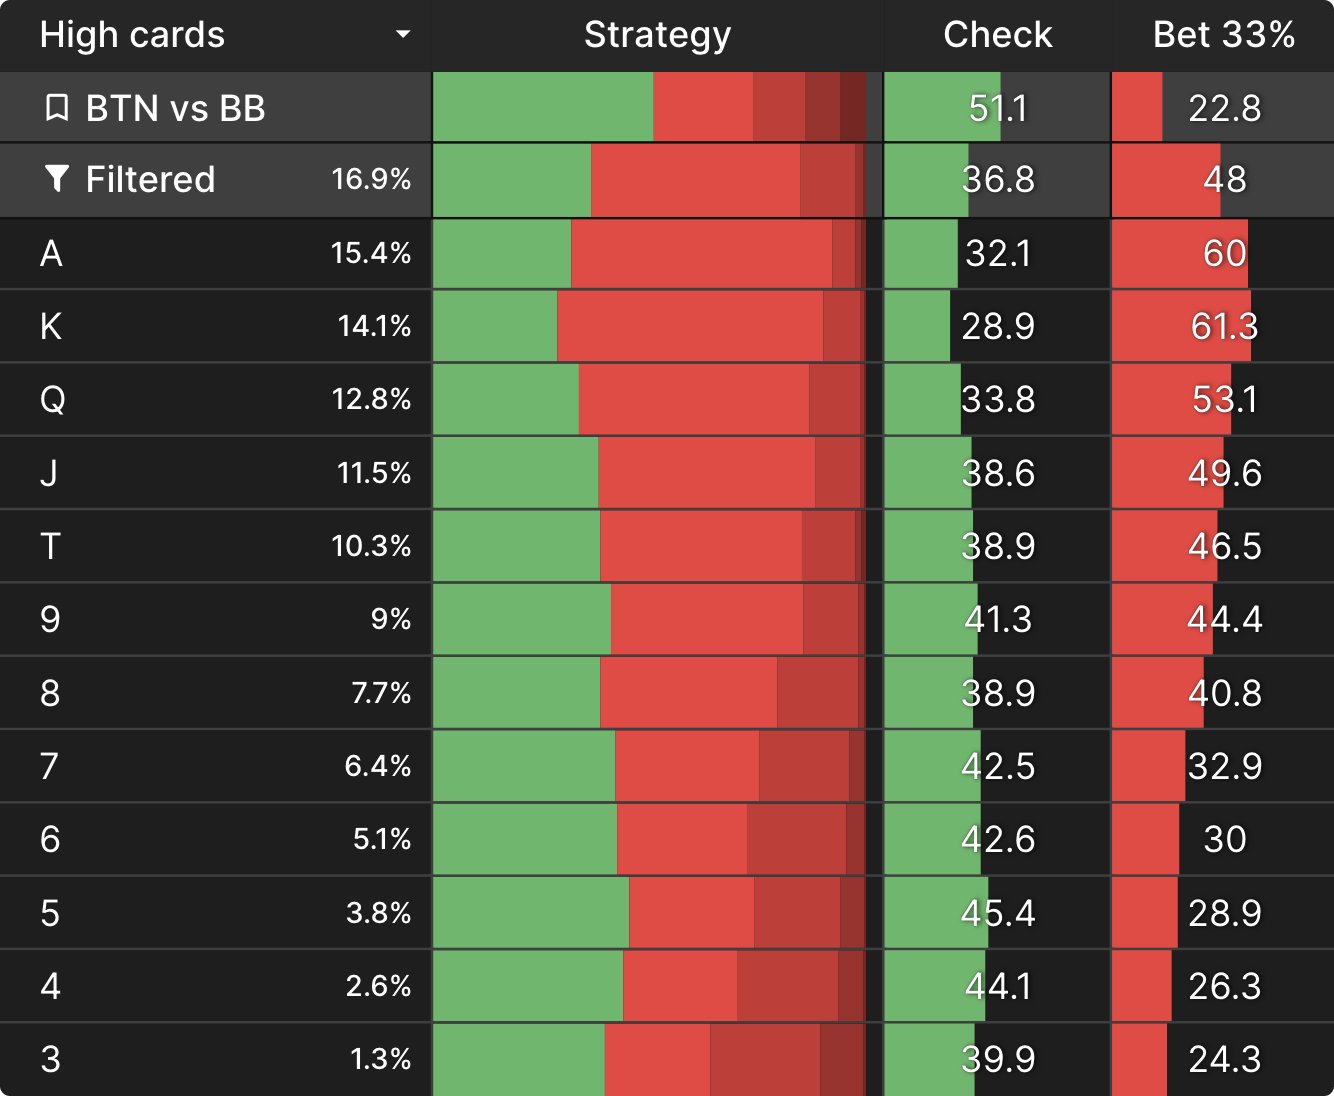
Strategy grouped by flop high card.
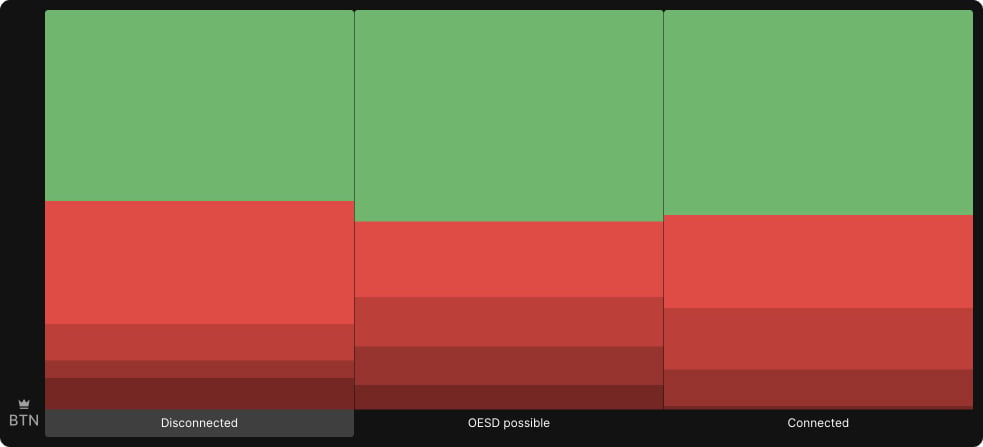
Grouped by connectedness:
- Disconnected – No straights possible
- OESD Possible – Open-ended straight draw is possible
- Connected – Straights are possible
You can view EV/EQ/EQR instead of strategy.
Grouping actions
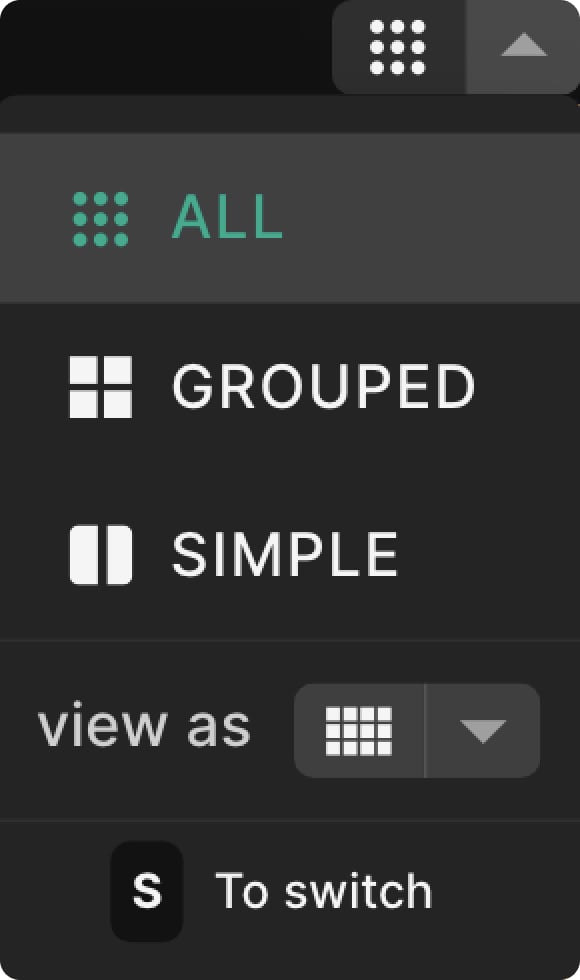
Group similar actions together using this dropdown, or simply press ‘S’.
- All shows all bet sizes
- Grouped puts similar bet/raise sizes together: small, medium, large and overbet
- Simple groups all similar actions together, e.g. all bet sizes become “bet”
- Graph will graph the bet sizes in the overall stats
Sorting
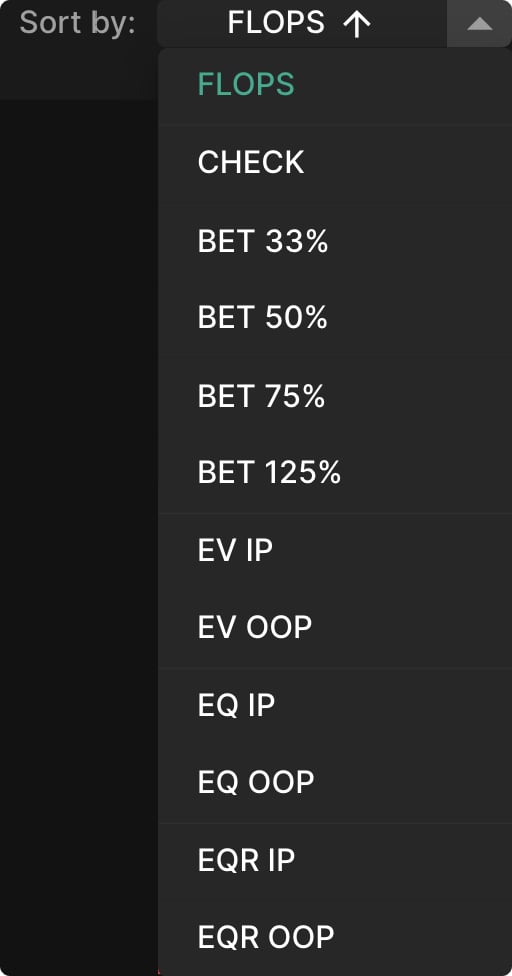
You can sort by actions, Expected value (EV), Equity (EQ), or Equity Realization (EQR).
Pay attention to the “filtered” row
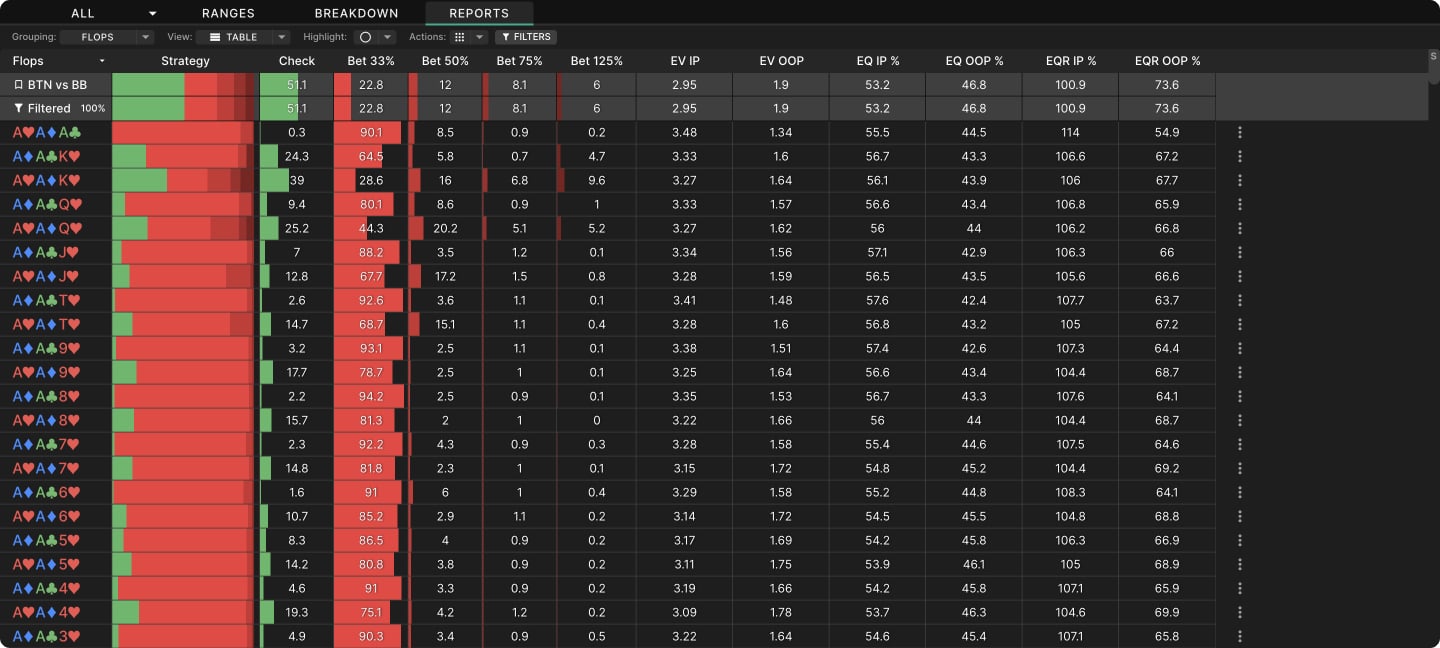
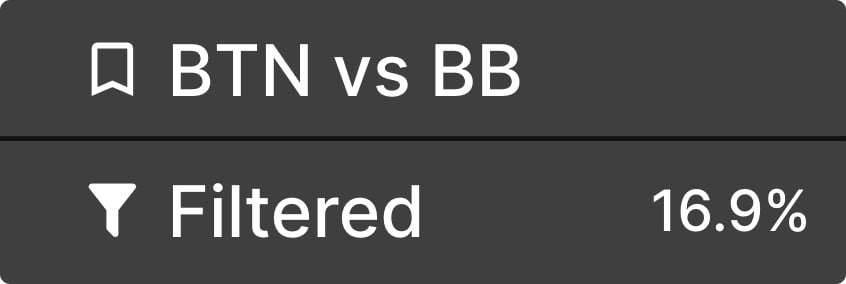
The filtered row contains data that you have explicitly filtered for. This is useful for comparing filtered data to the entire 1755 flop subset.
- The top row averages data over the entire 1755 subset.
- The 2nd “filtered” row tells you information about the flops you’ve filtered for. In this case, we can see that paired boards bet more often overall.
The percentage in the filtered row tells you what percentage of the total 1755 subset you have filtered for. In this case, 16.9% of all flops are paired.
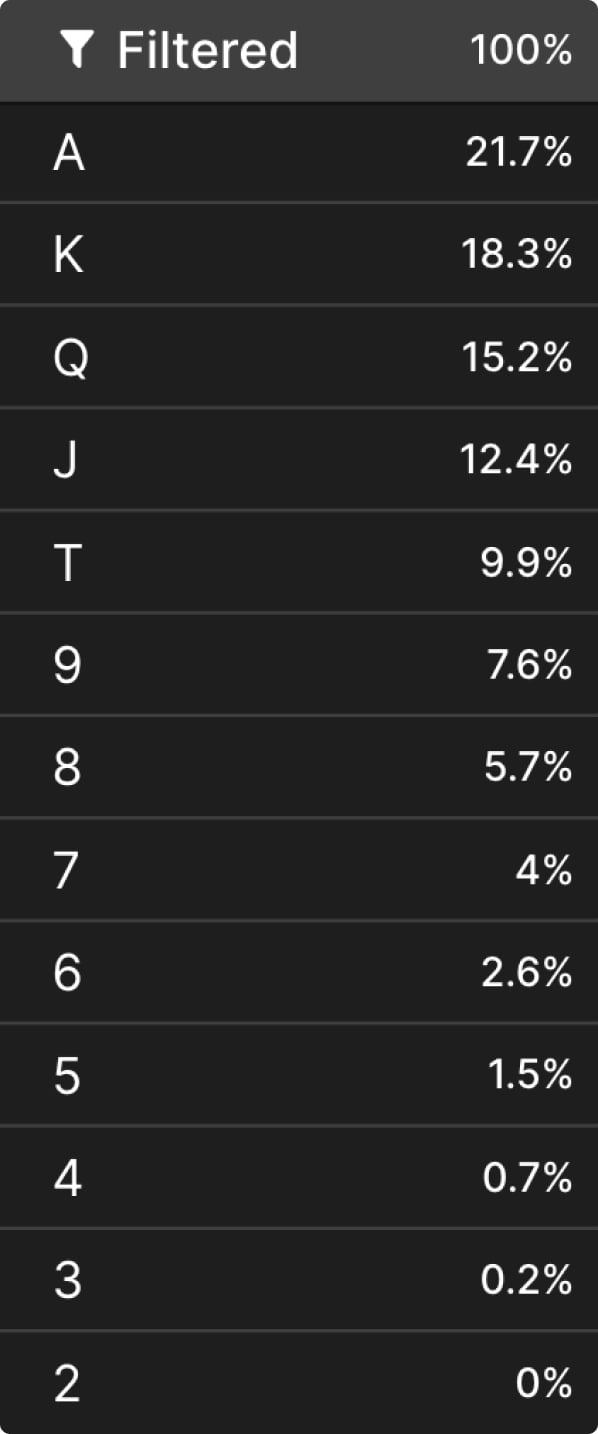
The percentages in the first column of each group indicate what portion of the report they represent. For example, only 4% of flops are 7-high, whereas 21.7% of flops are A-high.
Sorting
Click on any of the headers to sort the report. Use this in conjunction with action grouping to navigate complex reports more easily. For example, I’ve sorted by betting frequency and grouped all bet sizes into one column. As a result, we can see that paired king-high boards are bet at the highest frequency.
Highlight
Conditional Highlighting is a great way to view numeric data. Numbers below average are colored red, while above average numbers are green. Select the highlight dropdown in table mode to apply highlights:
- None – No Highlighting
- Background – Color-code background of data according to value
- Text – Color-code data according to value
Aggregate Turn Reports
Aggregate turn reports can be accessed from the Reports tab in the solution browser on any turn node. This report shows you data for all turn cards on a given flop. You can view the strategy, EV, EQ, EQR. You can sort and group data the same way as flop reports. Turn reports function similarly to aggregate flop reports. There are three key differences:
Sort by suits/cards/actions
The Chart and Default view allows you to sort turn cards by suits/cards/actions. Each sorting method is helpful for different board textures. You can sort by specific bet sizes using the table view.
Usage Examples
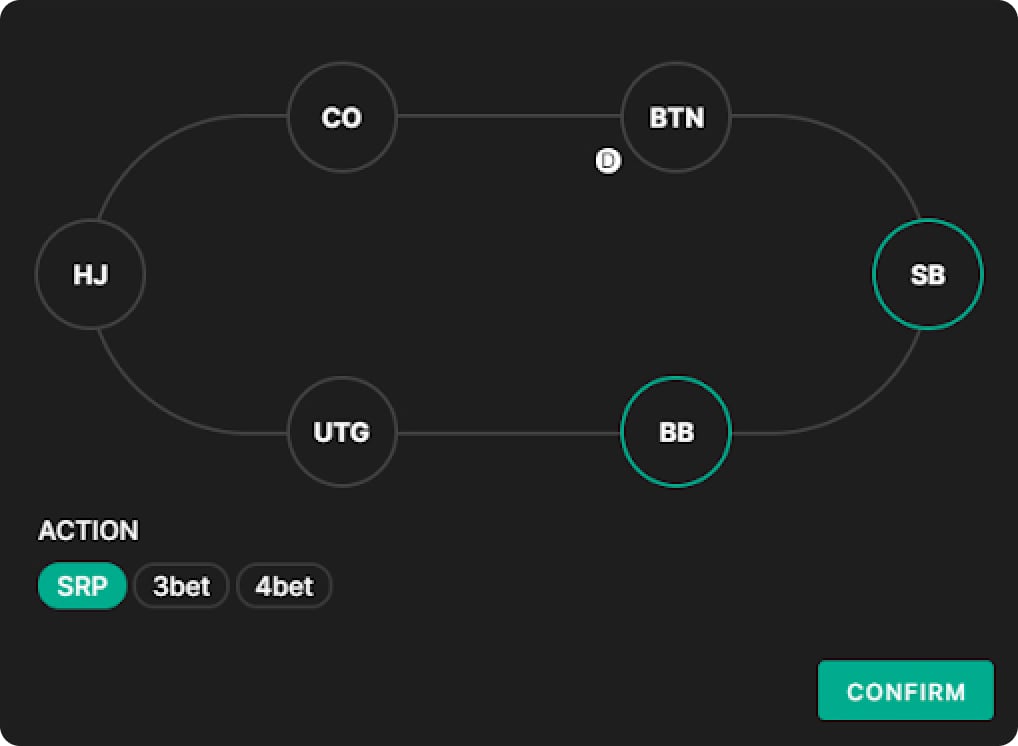
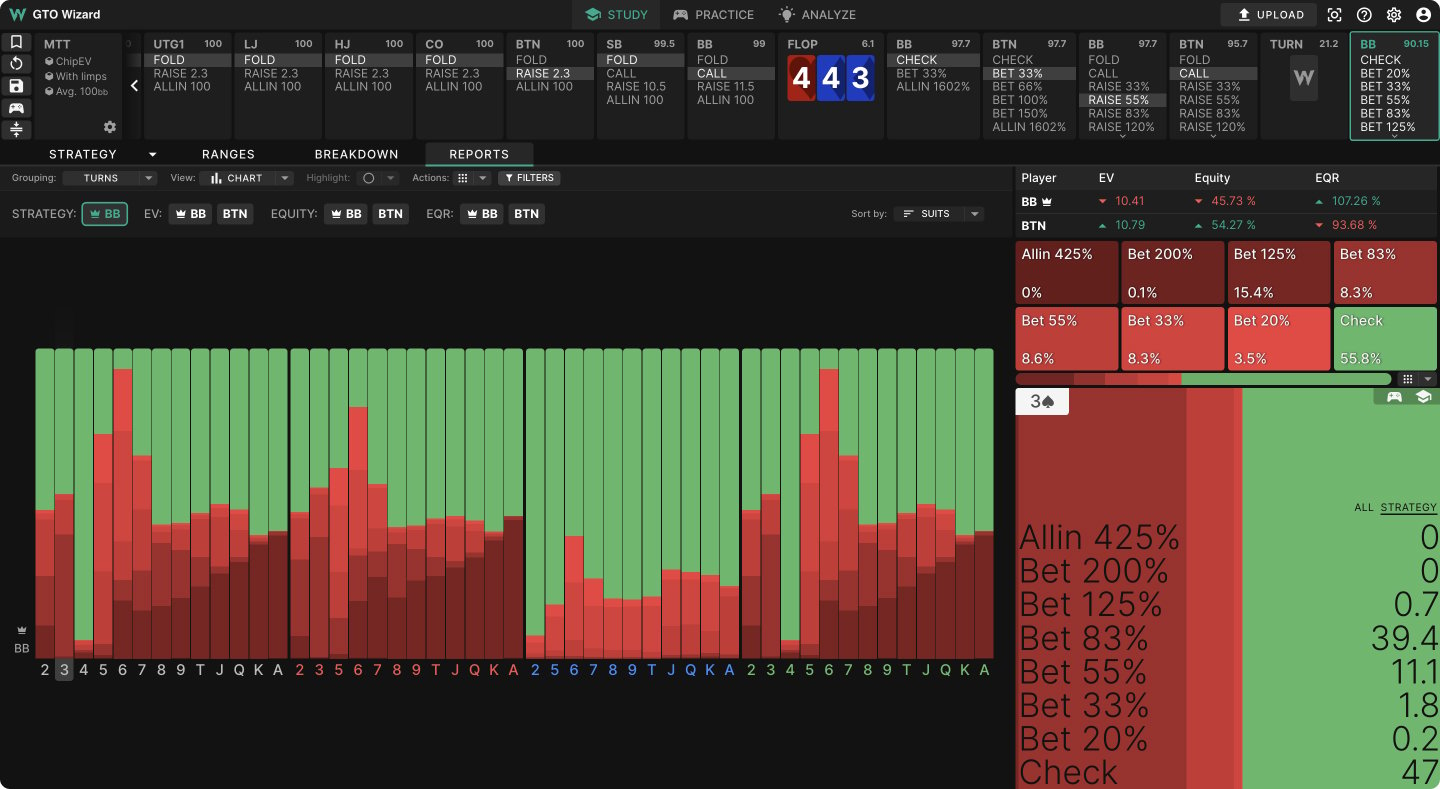
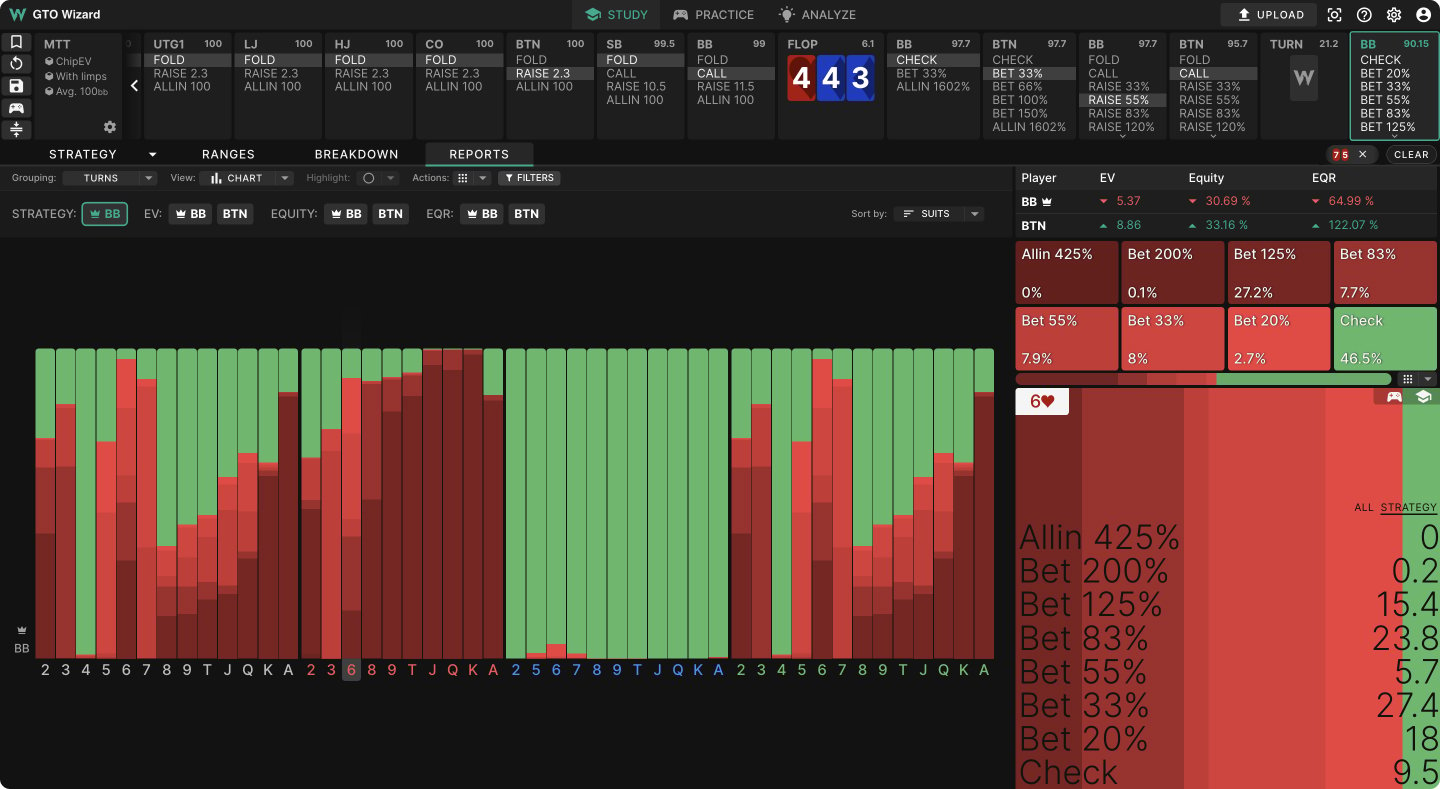
Example: BTN vs BB SRP. BB check-raised the 4♥4♦3♦ flop, got called. How should BB follow through on various turn cards? We open the reports tab to see a similar chart view setup, although we see different turn cards instead of different flops.
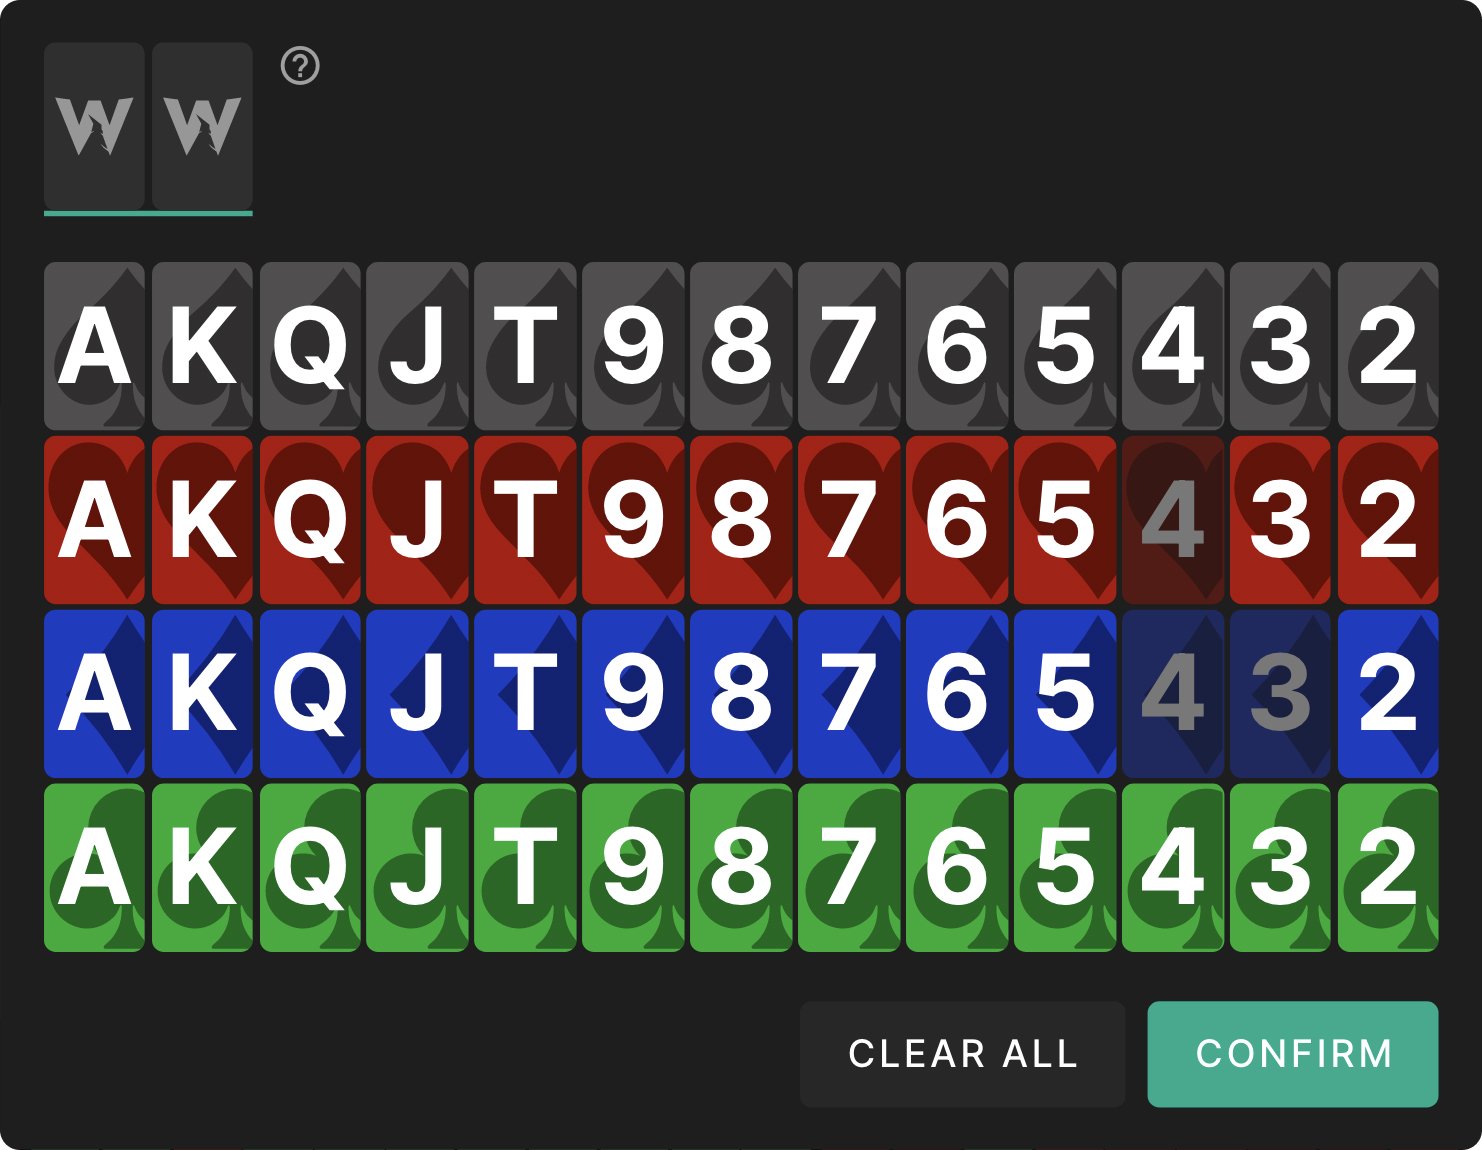
Let’s say we hold 7♥5♥. Select filter and enter our hole cards. This will show us the strategy of 7♥5♥ over all turns. Here I’ve sorted the data by suits. We can see at a glance that 7♥5♥ should barrel when we pick up a draw such as a turned FD, OESD, or gutshot, primarily using an overbet size.
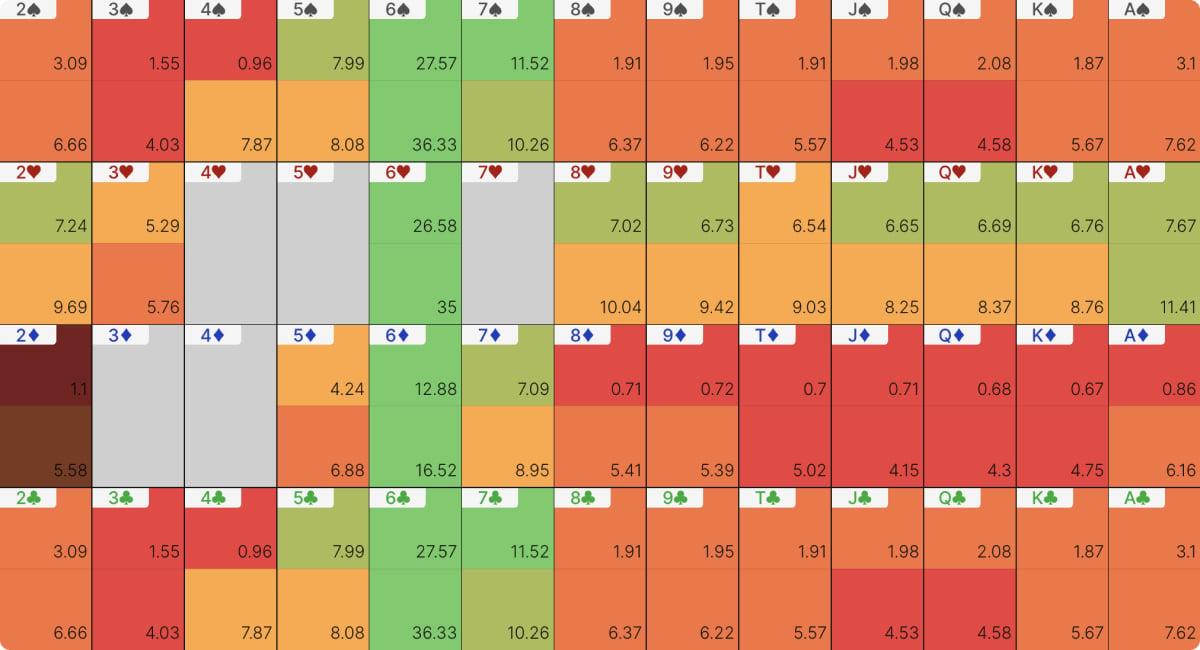
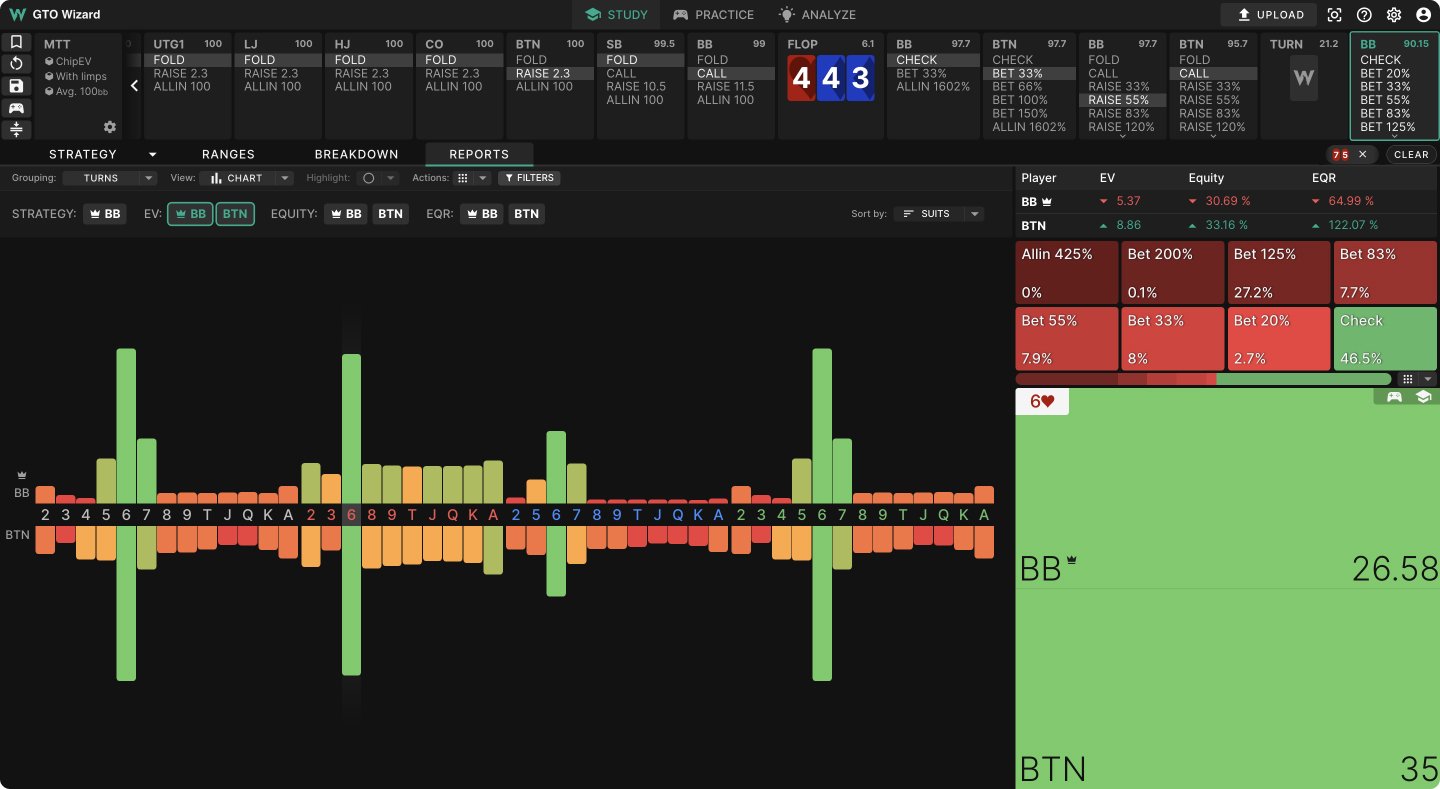
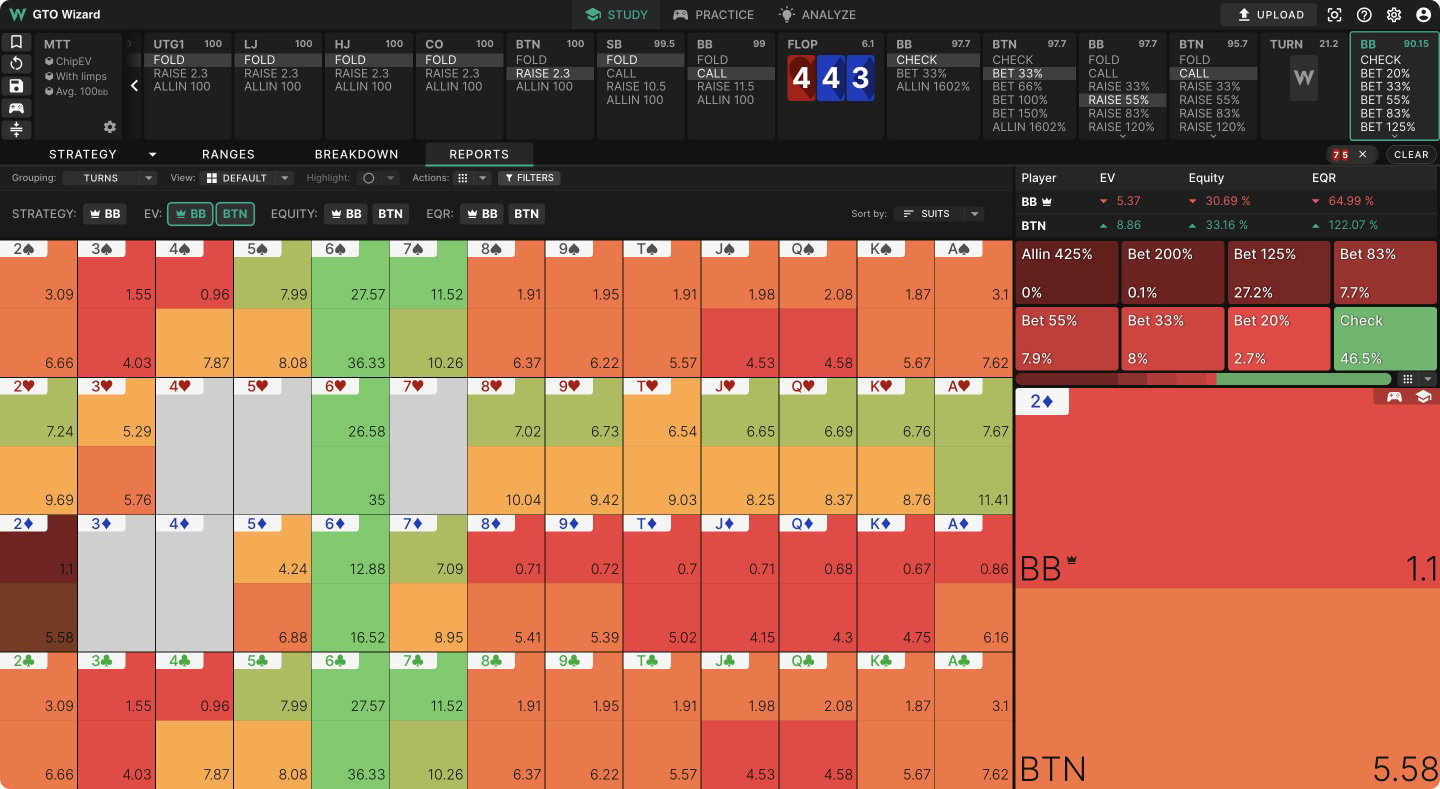
Let’s say I want to know the EV of both ranges across different turn cards. I’ve removed the filter, so now I’m looking at the entire range. I will select both BB and BTN’s EV as shown below. We can see that BB does well on most straight-completing turns, and does poorly on a 3 or 4.
While this view is aesthetically pleasing, we can’t see the actual EV’s unless we hover over each column. So I’ll switch to the “default view” to get a better overview.
GTO Wizard the #1 App for Poker players


