Ranges Tab
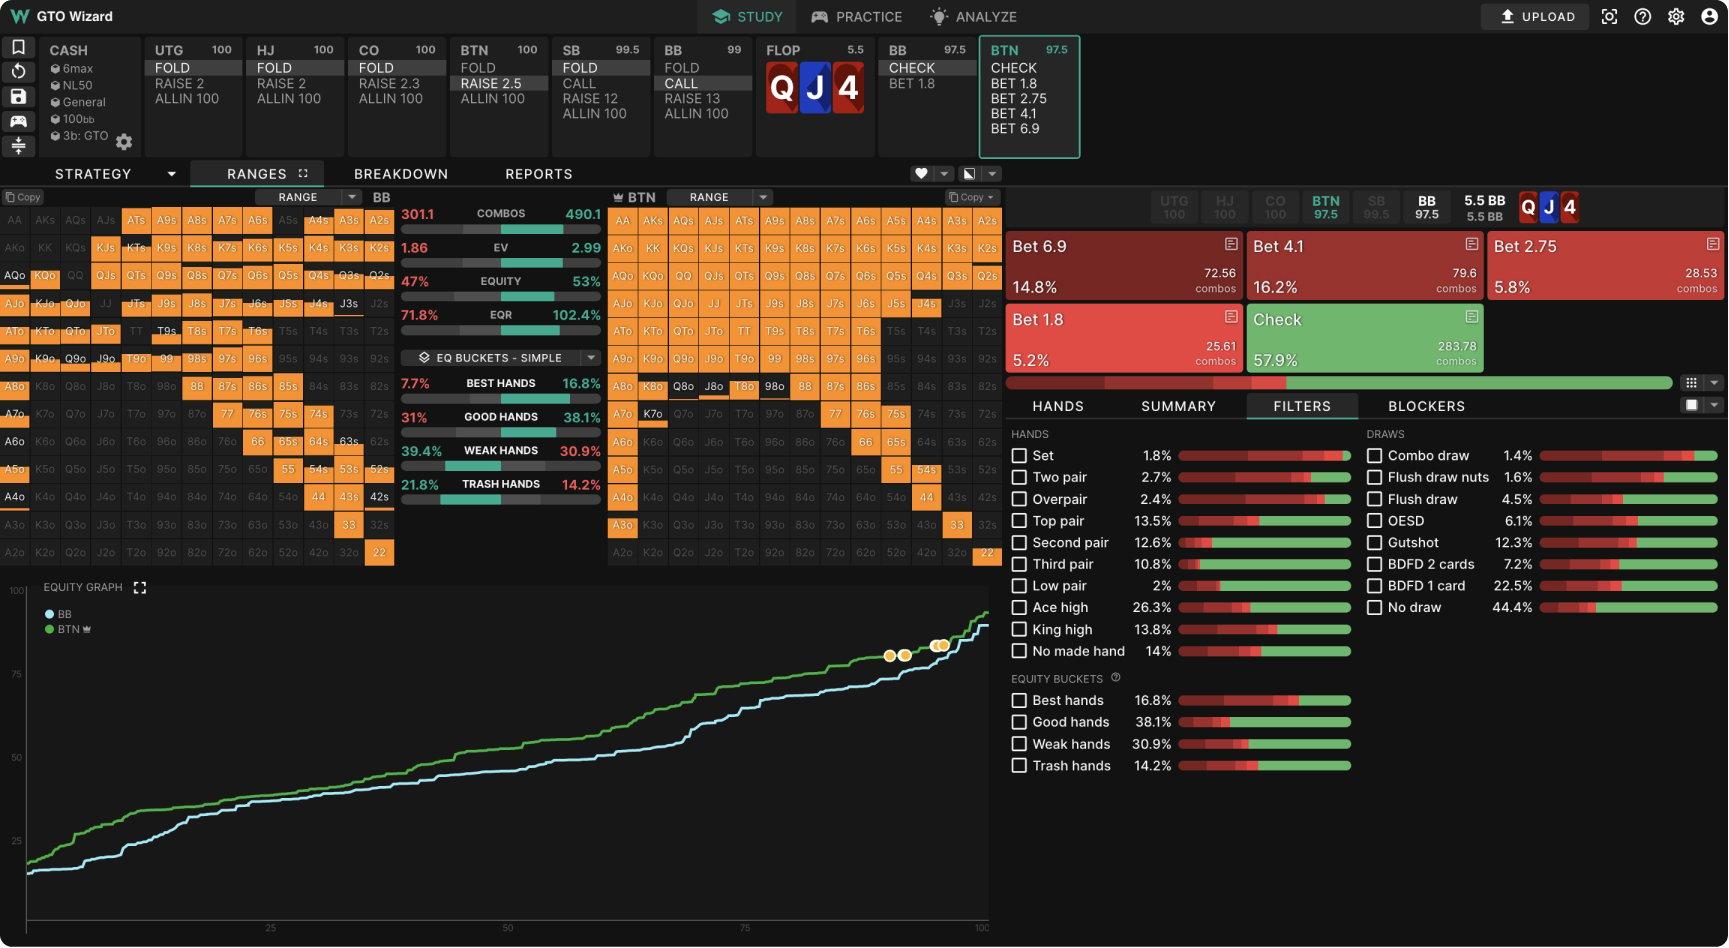
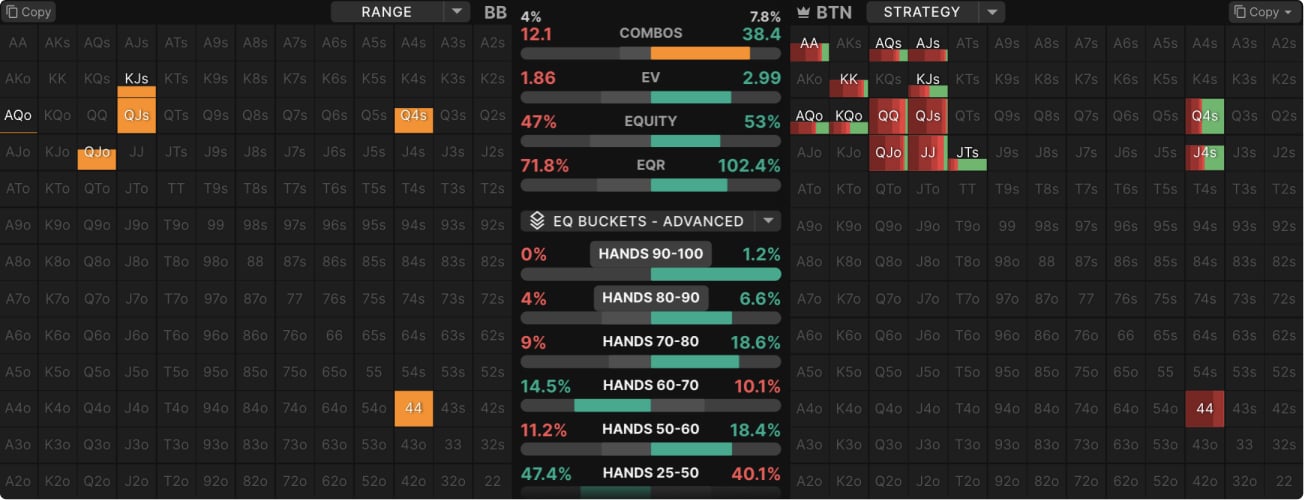
The Ranges Tab is a great way to compare and contrast how both players’ ranges interact. This feature presents you with a side-by-side comparison of both ranges with various filters to see how they interact with the board.
From here you can:
- View and filter by equity buckets
- View and filter by hand classes
- Copy ranges in Pio/GTO+ format. You can copy the entire range or the ranges of particular actions
- View the equity distribution graph
Table of contents
Full-screen mode
The Ranges Tab can be viewed in regular or full-screen mode.
Select the square icon to the right of the tab, or simply press ‘Q’.

Copy Ranges
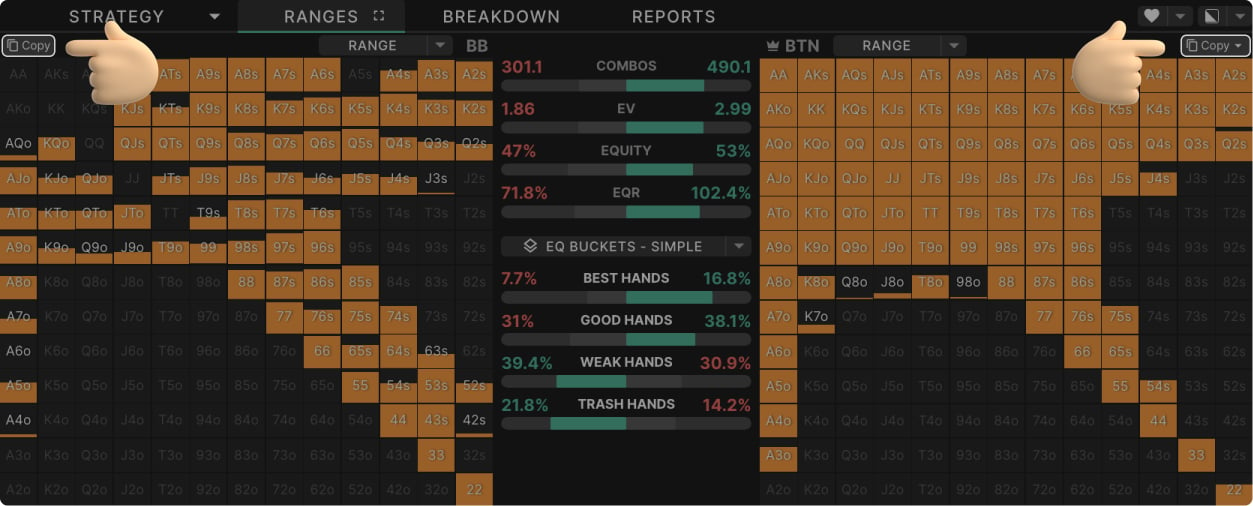
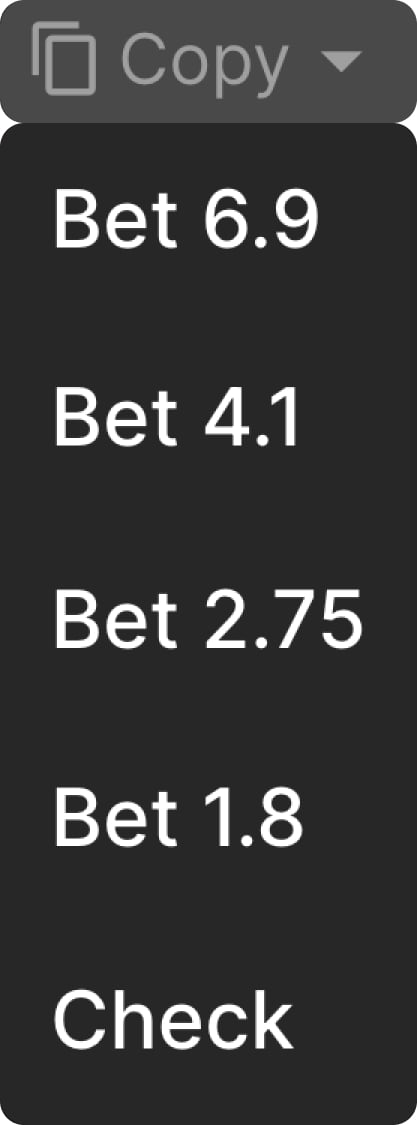
The ranges tab allows you to copy the ranges from any node into standard Piosolver / GTO+ text input. To do so, simply select the “copy” button above either player’s range.
Alternatively, you can select a specific part of their range. Select the dropdown of the active player, and you’ll have the option to copy the ranges of particular actions. For example, select “check” to copy BB’s checking range.
Equity Graph
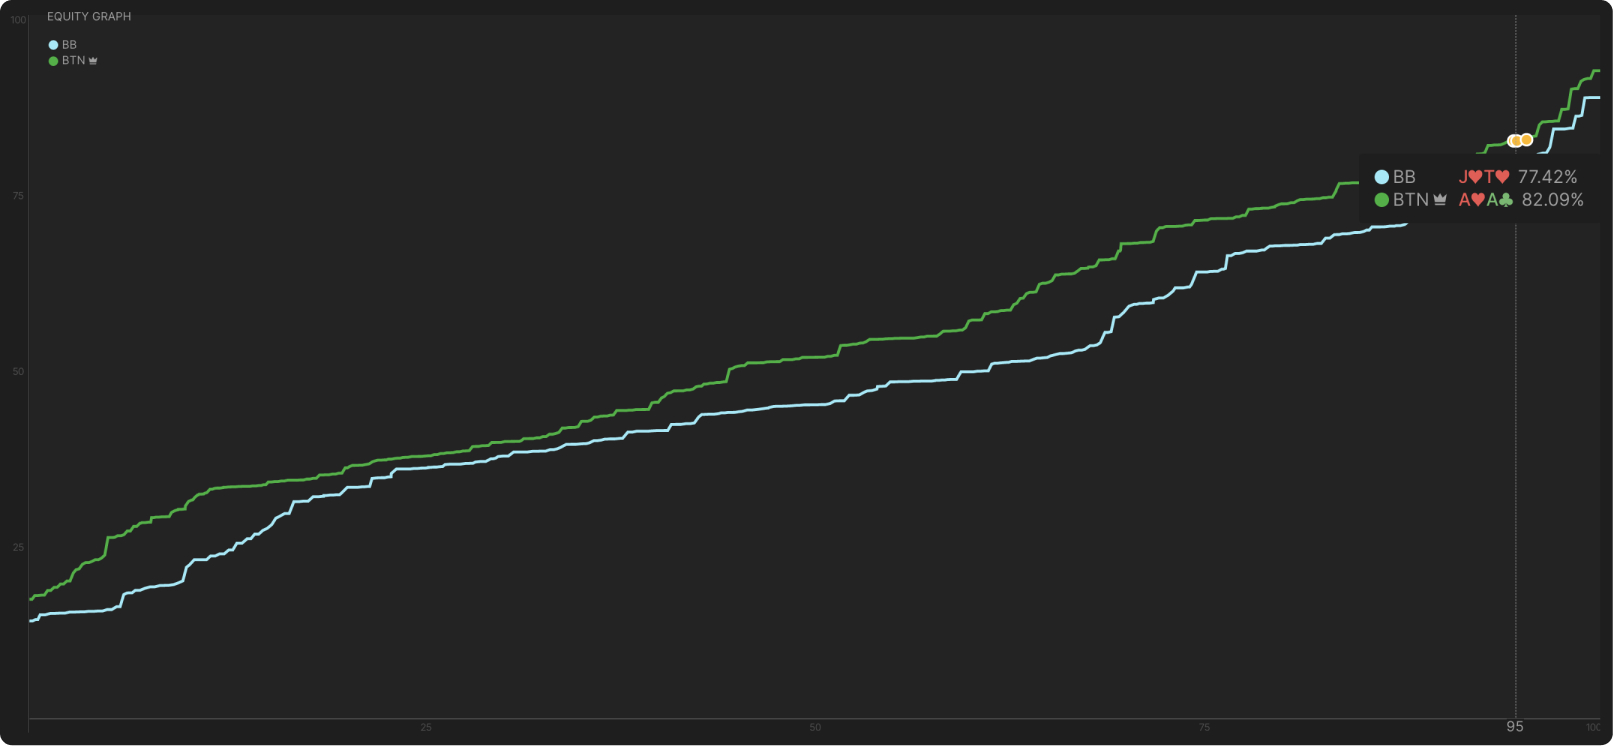
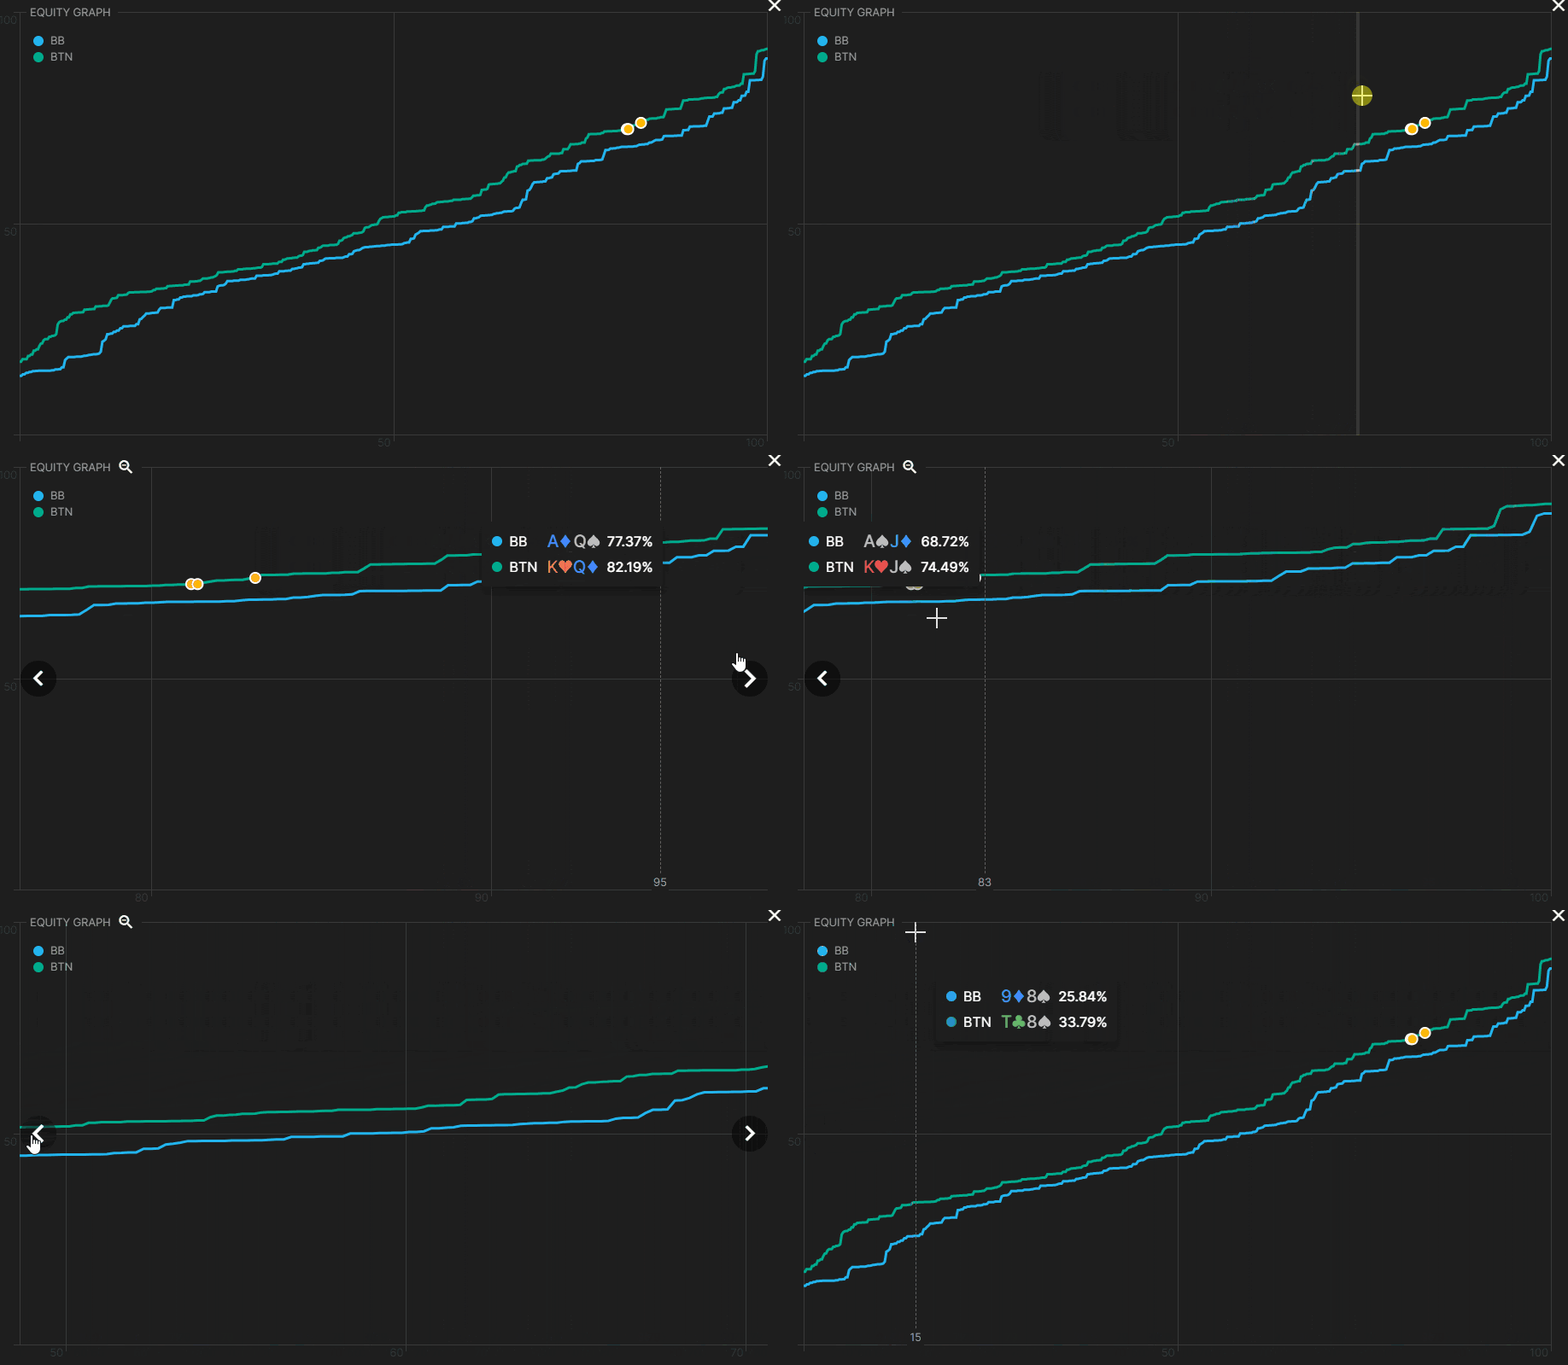
The equity distribution graph is an excellent tool for comparing the advantages of each player. Every point on this graph represents one combination, sorted by equity against the opposing range. Here I have selected AA, which displays several points on the BTN’s green line according to the equity of each combination of AA:
Read these guides to learn how to interpret equity distribution graphs:
Full Screen
Click this icon at the top right of the equity graph to toggle full-screen.

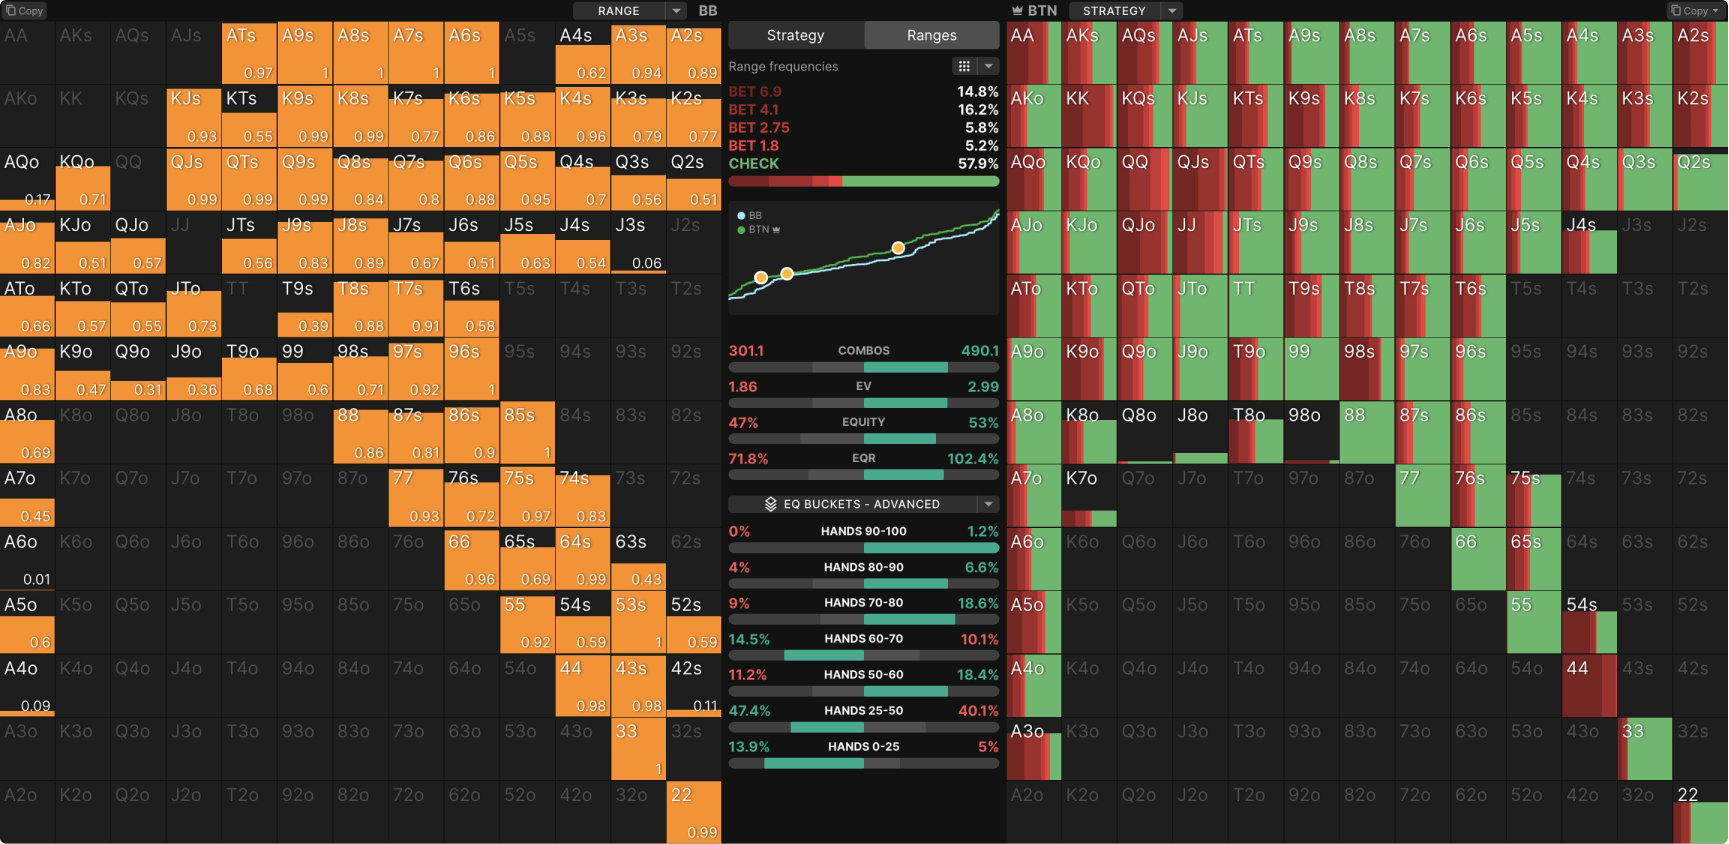
The percentages in white above this section display the portion of each range that pass your filtering criteria. In this case, we’ve filtered for hands with at least 80% equity against the opposing range using the advanced equity buckets dropdown. OOP (Left) has 4%, while IP (Right) has 7.8%, indicating a nut advantage for the BTN.
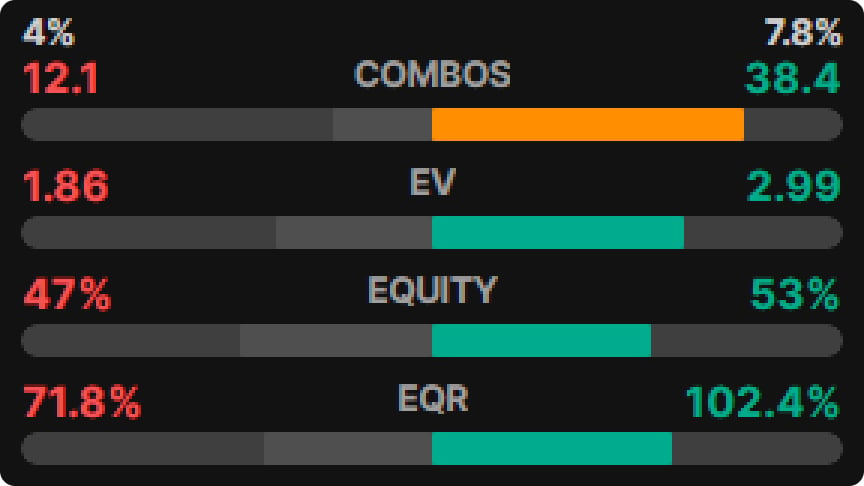
The comparison dropdown allows you to select and compare different parts of the ranges. You can compare:
- Equity buckets
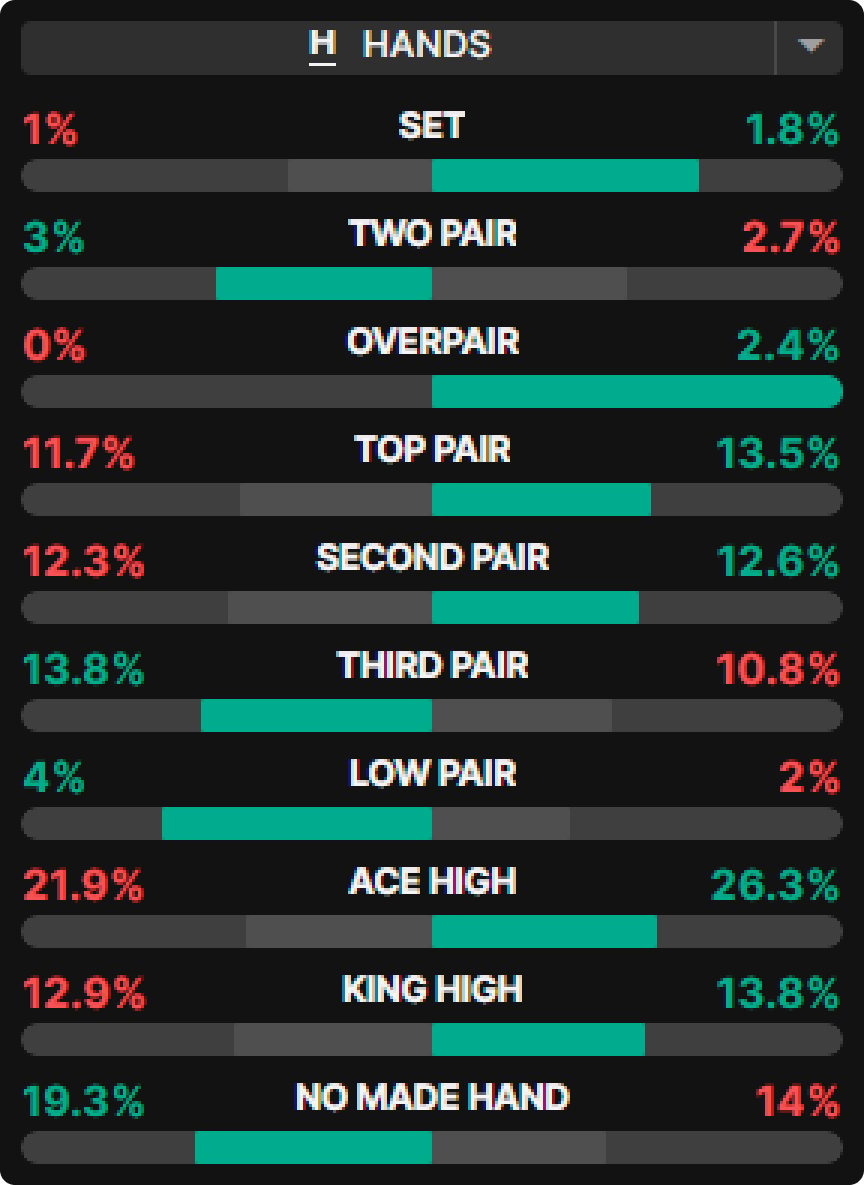
- Hand categories
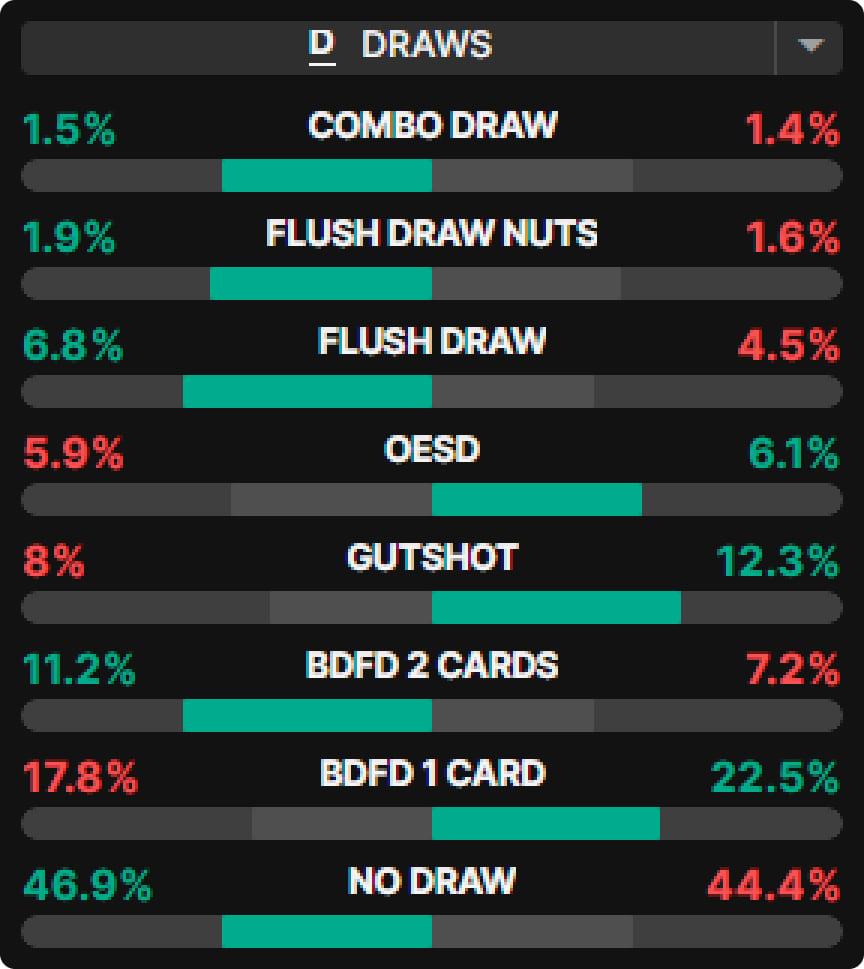
- Draw categories
Selecting any one of these hand classes will filter both ranges.
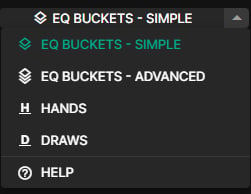
Equity Buckets
Equity buckets group hands according to their equity. You can use “Simple” or “Advanced” depending on how many equity buckets you want. For example, we can see that 5% of IP’s range (right) contains trash hands with 0-25% equity against OOP (left).
- IP stands for “In Position”, which represents the BTN in this case.
IP is always right. - OOP stands for “Out of position”, which represents the BB in this case.
OOP is left
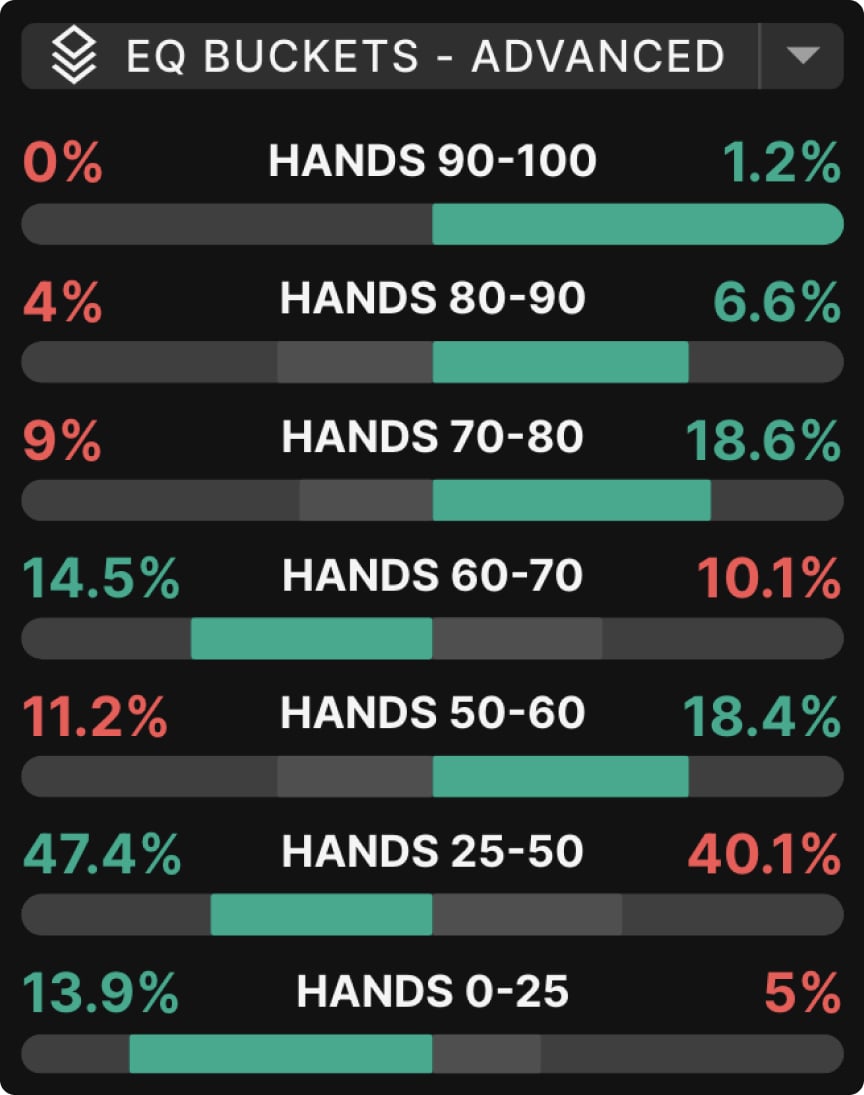
Equity buckets usage example
Here we can see that the player on the right (IP) has the nut advantage, as they have many more hands with 80%+ equity.
Select any one of these buckets to filter the ranges. For example, here I have selected 80%+ equity hands.
Watch this video to learn more about interpreting equity buckets!
Hands Comparison
The hands comparison tab allows you to compare and filter for hand classes between both ranges. Select one or multiple hand classes to filter for those in both ranges.
Draws Comparison
Similarly, you can compare and filter the draws in both ranges.

Display
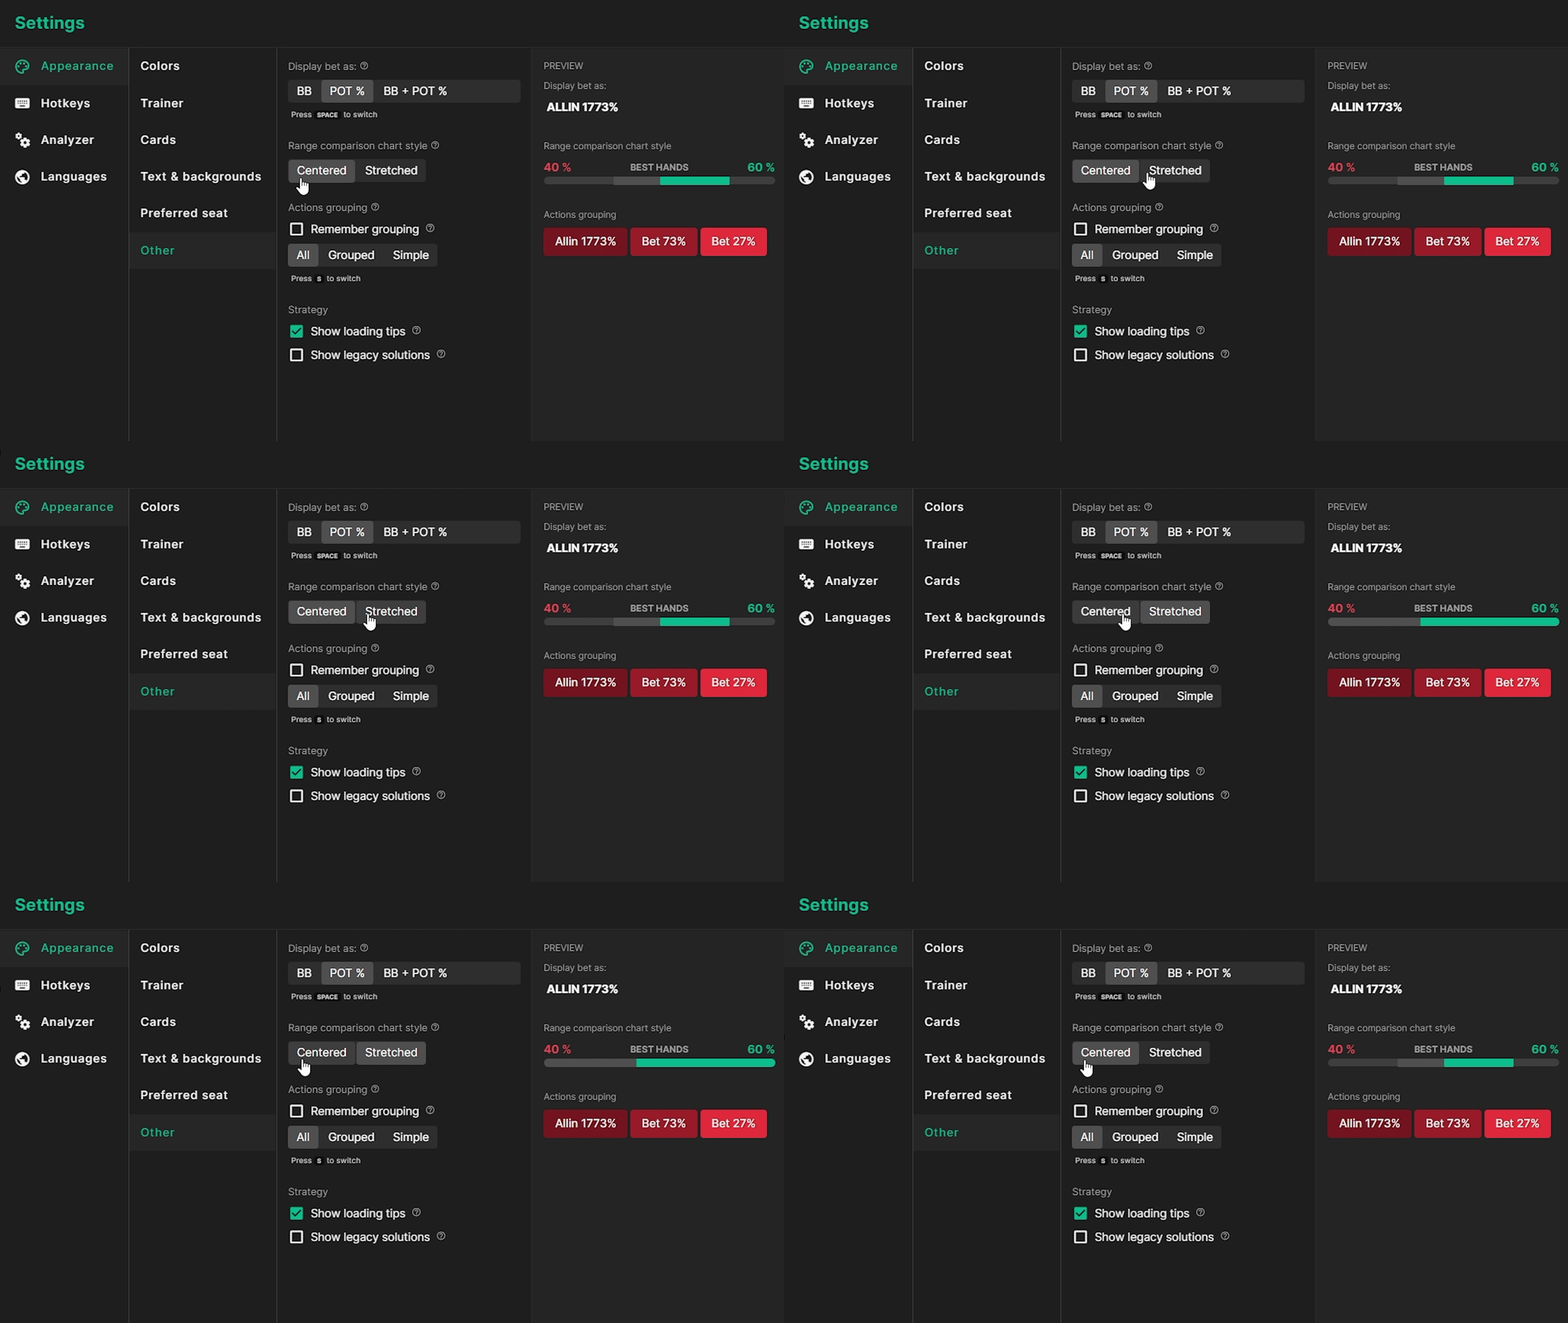
You can change the style of hand comparison graphs in the Ranges Tab in your settings (Appearance > Other > Centered/Stretched). Choose between Centered or Stretched styling.
GTO Wizard the #1 App for Poker players
